Hello ,
I have a standalone MongoDB instance is running on AWS , Instance type is t3 medium.
I have a db named gps and few collections with 65 MB data. I am doing query on collection gps_records. This collection has total 21133 documents. This is my query which is taking almost 1 min.
db.gps_records.aggregate([
  {
    $match: {
      vid: "65a26704938be343c0fa235e",
      added: {
        $gte: ISODate("2024-01-20T18:30:00.000Z"),
        $lte: ISODate("2024-01-30T18:29:59.000Z"),
      },
    },
  },

  {
    $lookup: {
      from: "addresses",
      localField: "k",
      foreignField: "k",
      as: "addressDoc",
    },
  },
  {
    $unwind: {
      path: "$addressDoc",
      preserveNullAndEmptyArrays: true,
    },
  },
  {
    $project: {
      id: 1,
      ac: 1,
      lat: 1,
      lng: 1,
      speed: "$spd",
      status: "$sts",
      added: 1,
      statusReportId: "$sr_id",
      poi: 1,
    },
  },
  {
    $sort: {
      added: 1,
    },
  },
])
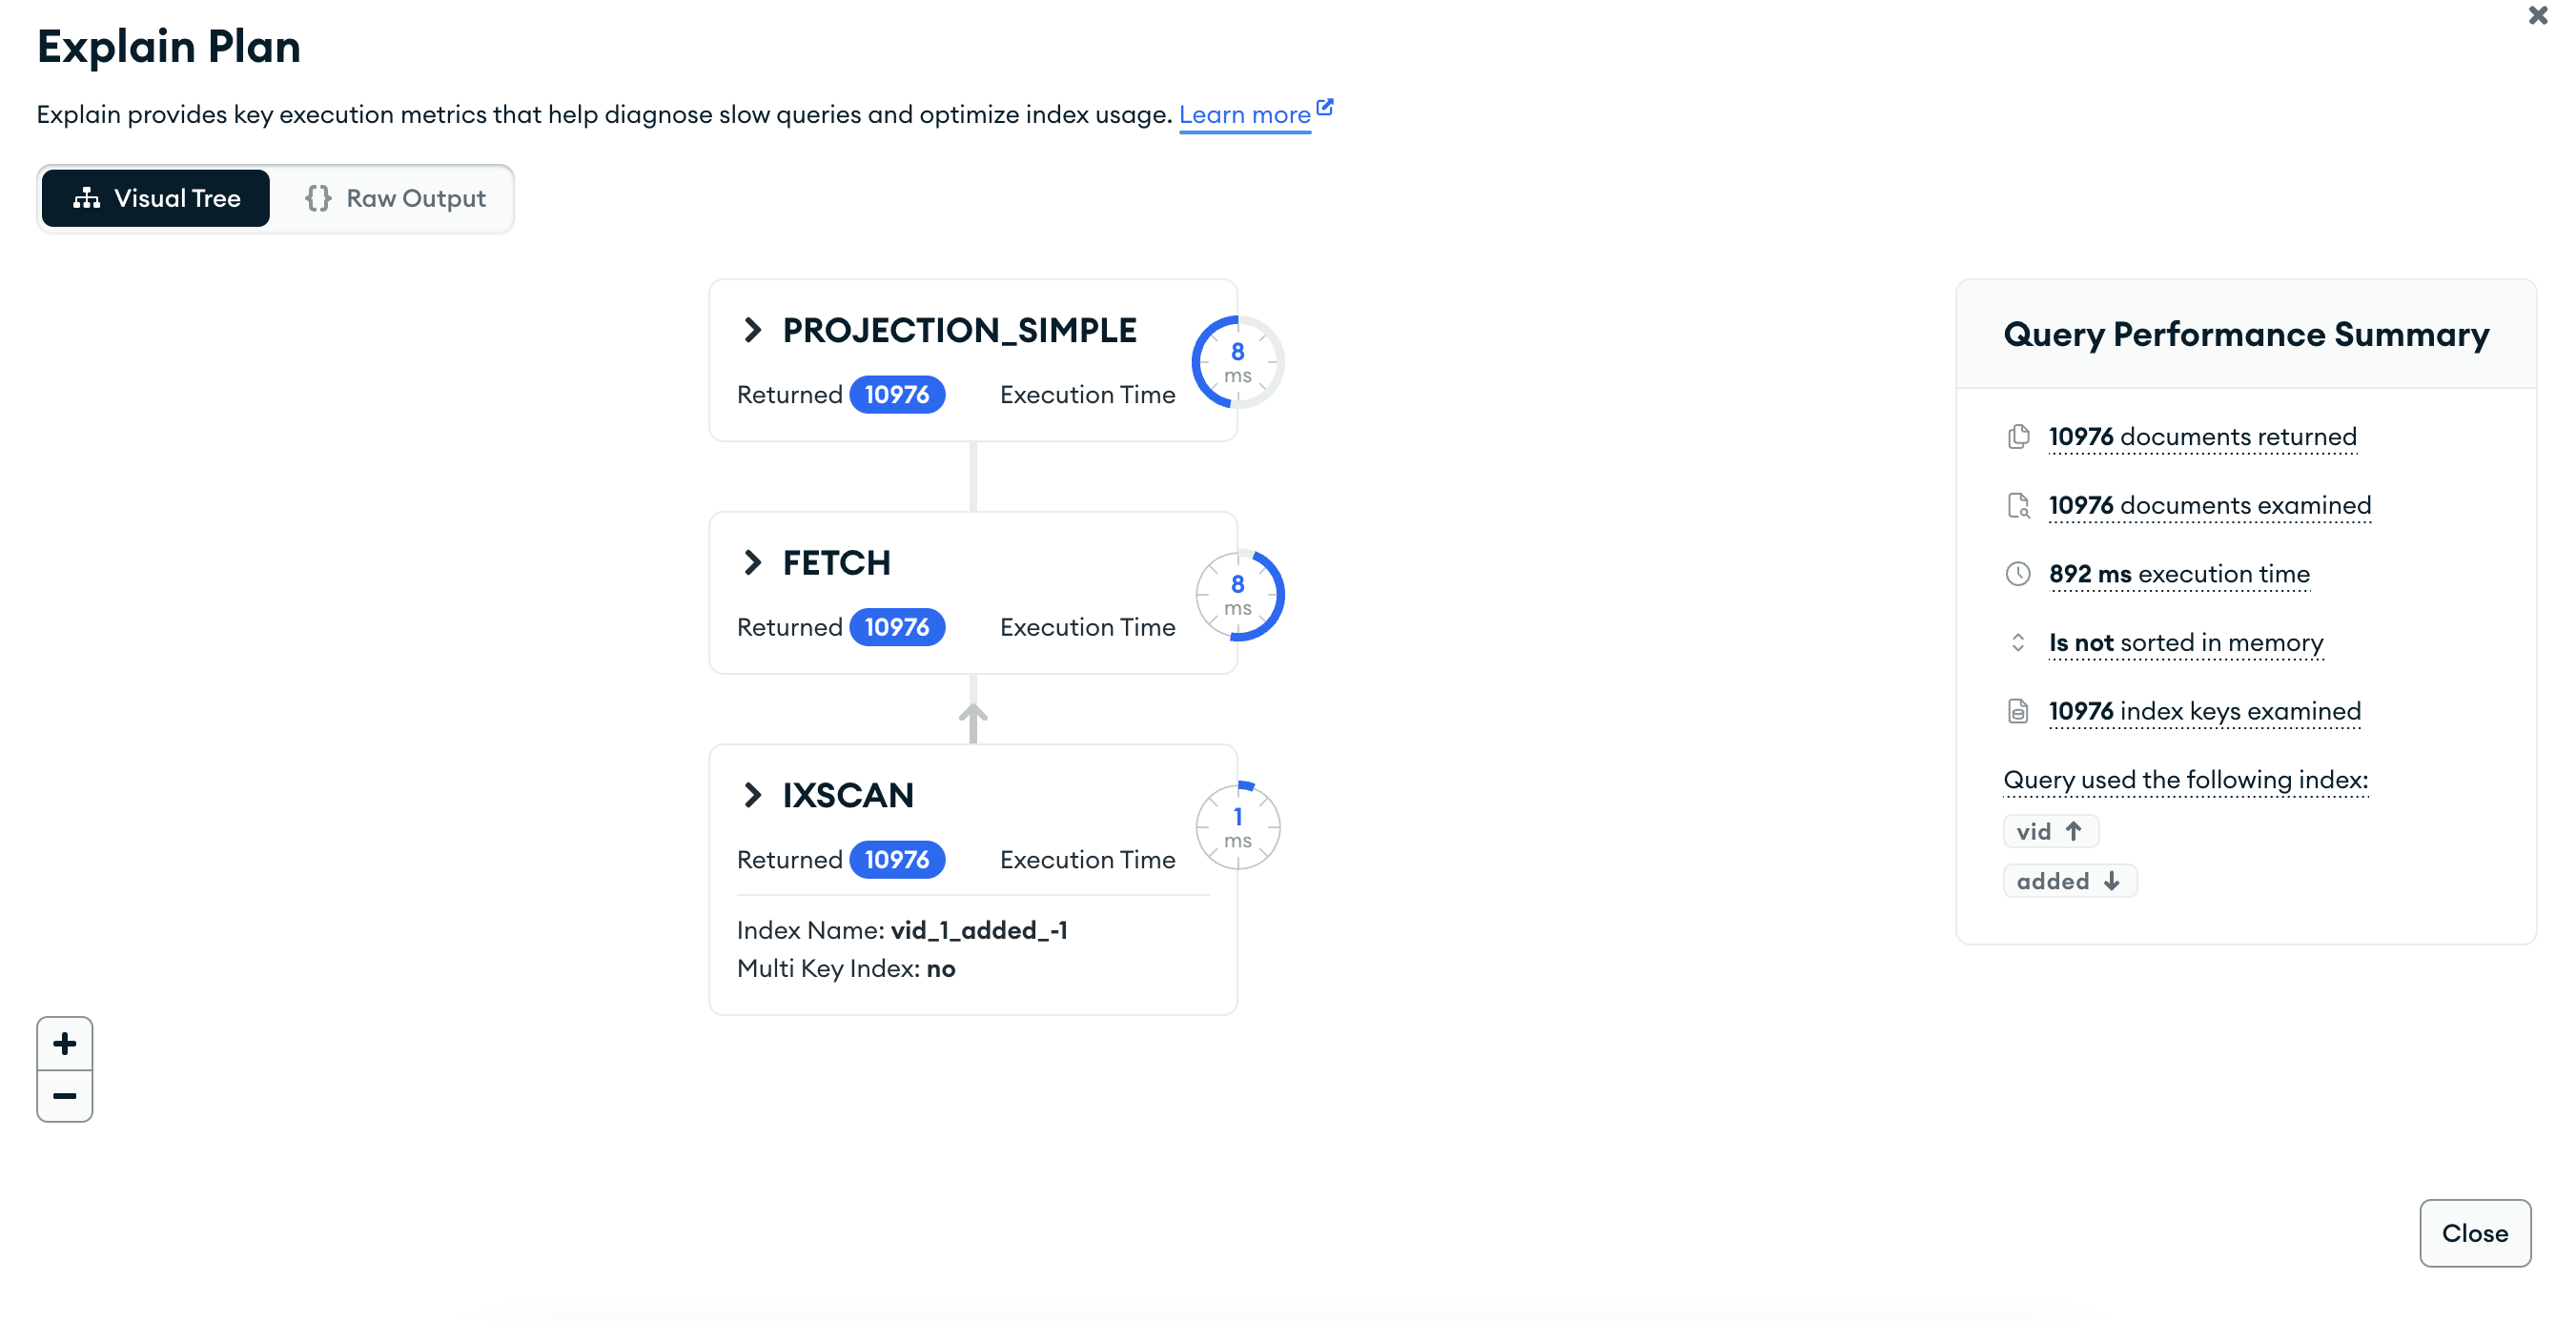
But in logs is showing logs “durationMillis”:892
{“t”:{“$date”:“2024-01-30T18:19:37.162+00:00”},“s”:“I”, “c”:“COMMAND”, “id”:51803, “ctx”:“conn93”,“msg”:“Slow query”,“attr”:{“type”:“command”,“ns”:“gps.gps_records”,“appName”:“MongoDB Compass”,“command”:{“explain”:{“aggregate”:“gps_records”,“pipeline”:[{“$match”:{“vid”:“65a26704938be343c0fa235e”,“added”:{“$gte”:{“$date”:“2024-01-20T18:30:00.000Z”},“$lte”:{“$date”:“2024-01-30T18:29:59.000Z”}}}},{“$lookup”:{“from”:“addresses”,“localField”:“k”,“foreignField”:“k”,“as”:“addressDoc”}},{“$unwind”:{“path”:“$addressDoc”,“preserveNullAndEmptyArrays”:true}},{“$project”:{“id”:1,“ac”:1,“lat”:1,“lng”:1,“speed”:“$spd”,“status”:“$sts”,“added”:1,“statusReportId”:“$sr_id”,“poi”:1}},{“$sort”:{“added”:1}}],“cursor”:{},“maxTimeMS”:60000},“verbosity”:“allPlansExecution”,“lsid”:{“id”:{“$uuid”:“c57667e1-6afc-4bea-8d12-e77c2f500e8b”}},“$db”:“gps”},“planSummary”:“IXSCAN { vid: 1, added: -1 }”,“numYields”:10,“queryHash”:“5C3D15E7”,“planCacheKey”:“4D39CAB4”,“reslen”:4138,“locks”:{“ParallelBatchWriterMode”:{“acquireCount”:{“r”:1}},“FeatureCompatibilityVersion”:{“acquireCount”:{“r”:21965}},“ReplicationStateTransition”:{“acquireCount”:{“w”:1}},“Global”:{“acquireCount”:{“r”:21965}},“Database”:{“acquireCount”:{“r”:1}},“Collection”:{“acquireCount”:{“r”:1}},“Mutex”:{“acquireCount”:{“r”:21955}}},“storage”:{},“remote”:“103.82.125.152:58627”,“protocol”:“op_msg”,“durationMillis”:892}}
**Even when I explained this query showing 892 MS only but when I am runing query its taking almost 1 min **