I know the metrics provided by Atlas on the metrics page as well as the query insights and query profiler.
Using the metrics I see that ~1.000 queries/sec lead to ~13.000 returned documents.
Probably we don’t have all queries with 13 docs returned each but some of them returning a very high number of documents.
What I don’t know is on which collections the queries that return that much documents are operating on.
Is there a way to have metrics like returned documents, amount of queries, inserts, updates, … on a collection level?
So far I could not find anything like this. Neither on the Atlas metrics page nor in the mongodb metrics exposed to our Prometheus instance.
Maybe (hopefully) I’m currently overseeing something …
Thank you for your question and for being a part of the MongoDB community!
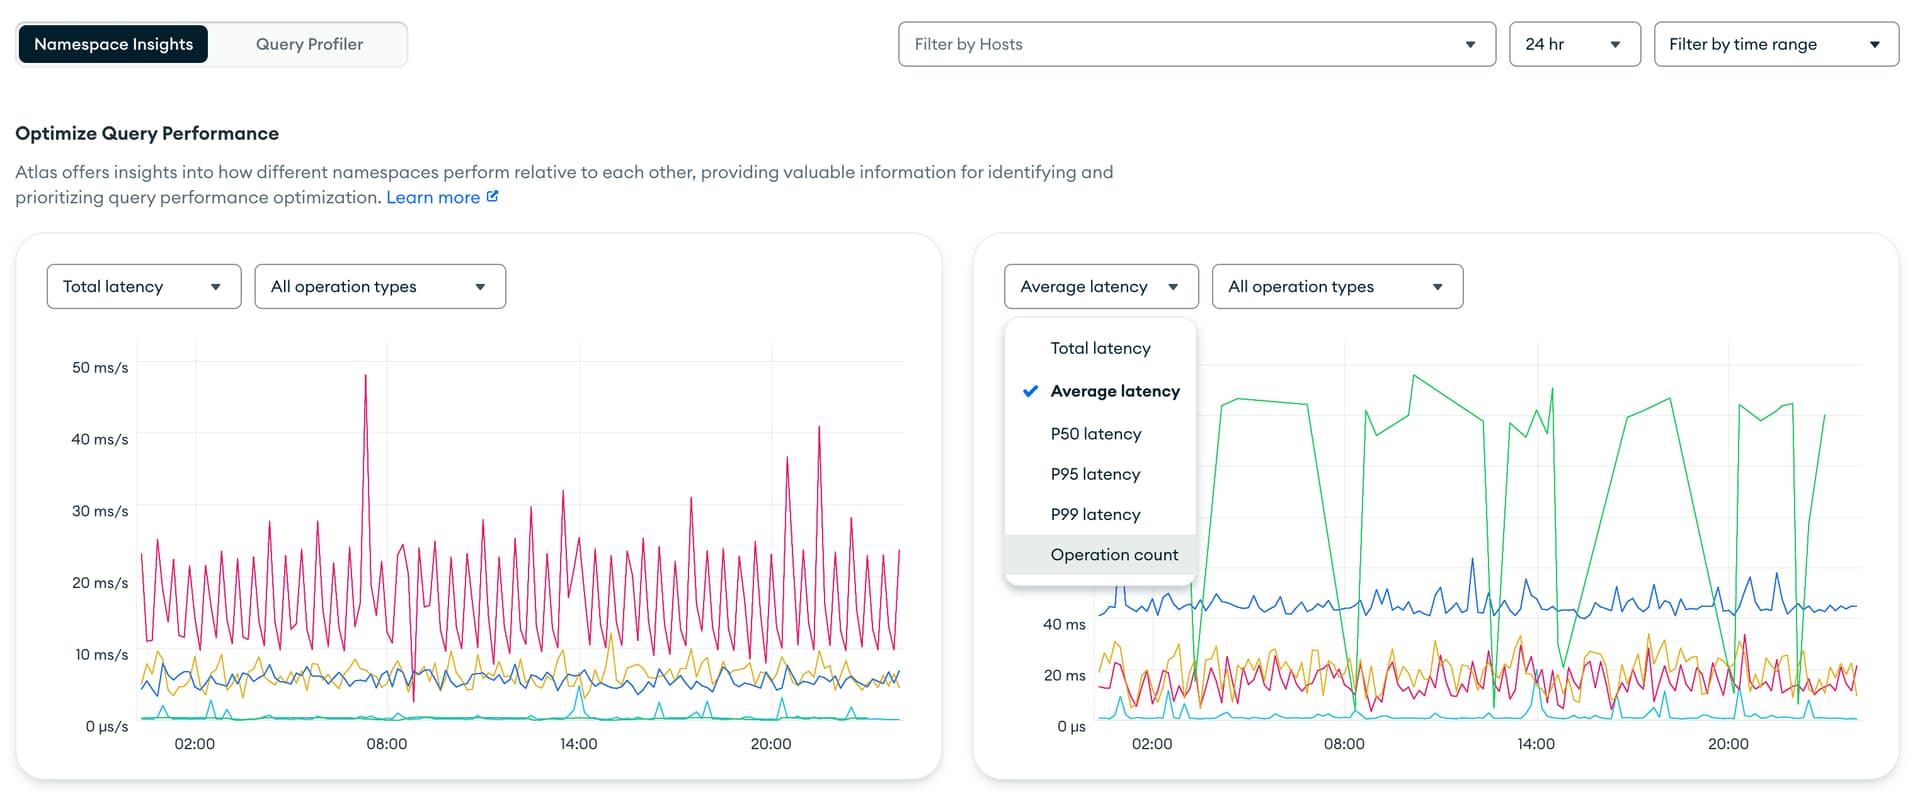
The new Namespace Insights page in Atlas does provide some of the metrics you may need. For example, in the screenshot below, if you click on the metrics dropdown, you will be able to see the number of operations per collection. You can then further filter with the operation types dropdown to see the number of reads/writes/commands per collection.
Unfortunately, the Namespace Insights page does not show the number of documents scanned or documents returned. However, in MongoDB v7.2, we introduced a new aggregation stage called $querystats. This new stage does return the number of documents scanned and the number of documents returned at a query shape level.
These query shape metrics are not yet available in the Atlas UI today, however, will be coming in the near future!
I hope this helps and please let me know if you have any further questions.