I wanted to Integrate Mongodb Atlas with Grafana for Monitoring.
But I face some problem while connecting with Prometheus.
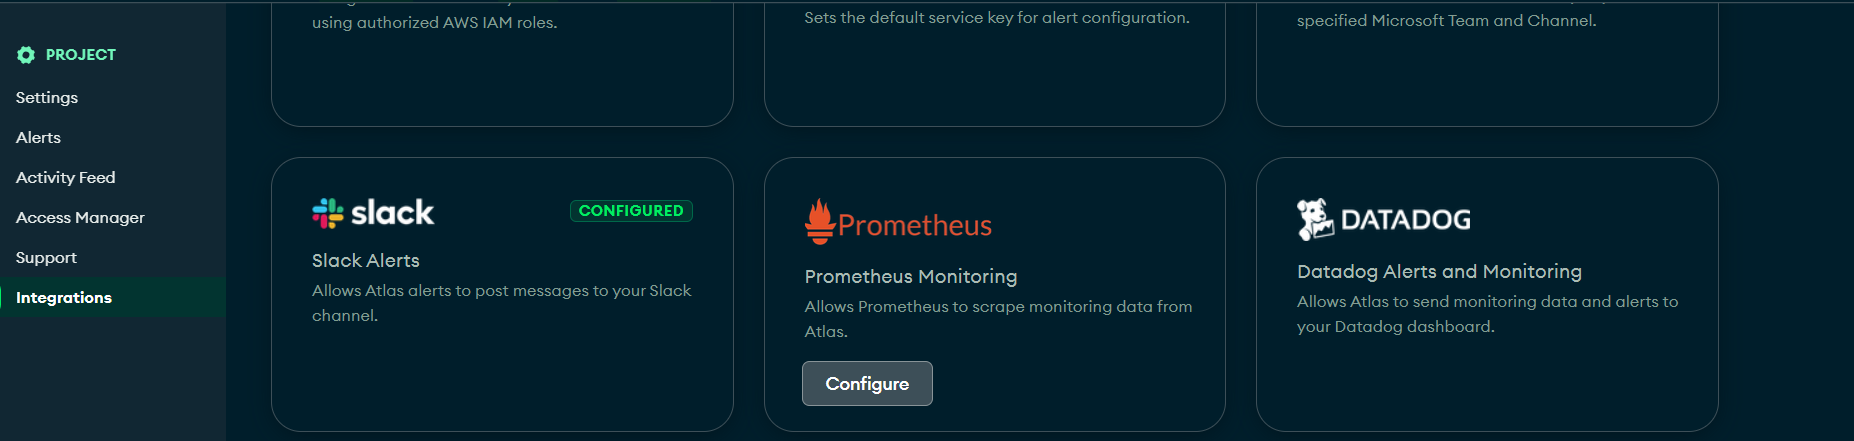
I can see Prometheus In Integration.
But When I configure that it show some error .
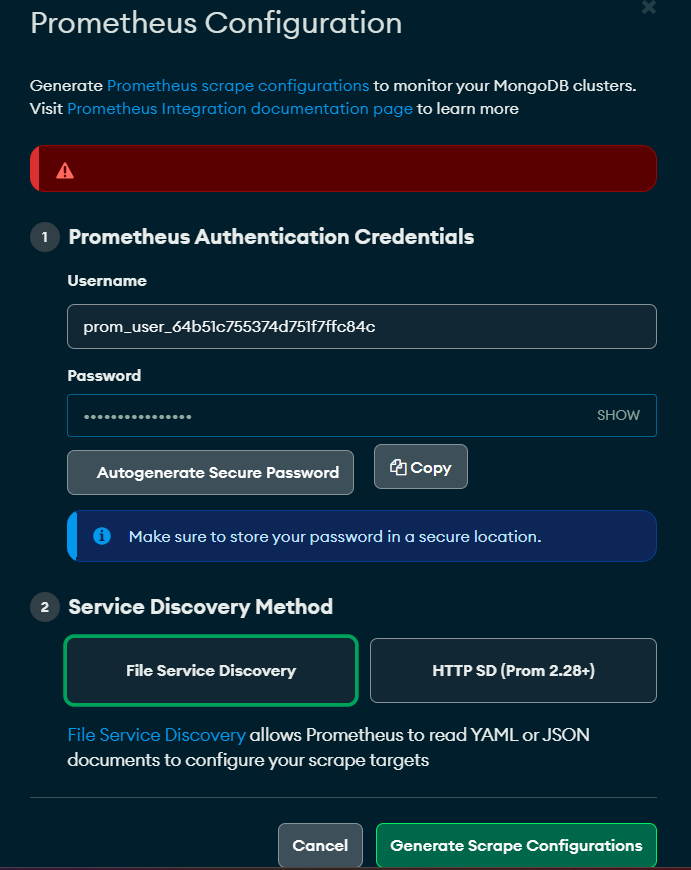
and Its not showing the exact error what is happening.
I am not able to find the exact cause why its happpening.
I am using mongodb version: 5.0.23
Thanks in advance.