Hello!
I’m running a MongoDB cluster with 2 mongos routers, 3 config servers and 4 replica set shards. Replica sets are set up PSA style (Primary, Secondary, Arbiter). This has been working fantastically for the last month - now all of a sudden my ingest rates dropped and the server logs don’t indicate that there’s a problem.
The ingest rate of the Mongos servers went from about 50MB/s to 5MB/s, and the CPU usage dropped similarly - from ~35% usage to 9%.
All of the logs and metrics are in Splunk - so I can search them all easily if needed. There are no errors that seem relevant - this is the only error actually - but only 150 total in 4 hours.
{“t”:{“$date”:“2022-01-19T15:38:45.728+00:00”},“s”:“I”, “c”:“CONNPOOL”, “id”:22572, “ctx”:“ShardRegistry”,“msg”:“Dropping all pooled connections”,“attr”:{“hostAndPort”:“hostname-here:27017”,“error”:“ShutdownInProgress: Pool for hostname-here:27017 has expired.”}}
I think the problem might be that the cluster members are using all of the disk IO available - but what would it be doing? Rebalancing the shards?
Here’s the last hour for one of the replica set members from my Splunk dashboard.
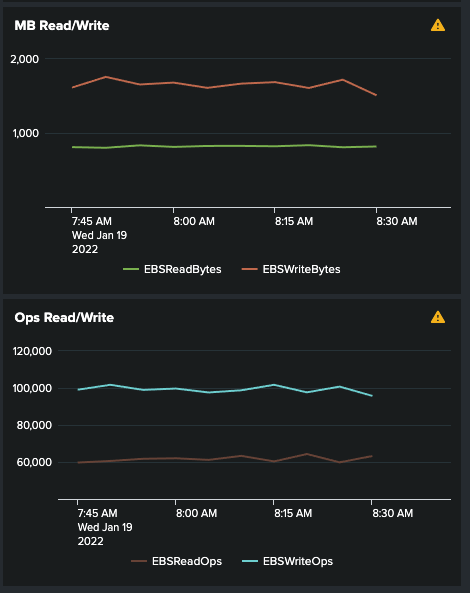
Last night I doubled the IOPS and Throughput on each storage volume and it seems as though the servers started using the bandwidth right away. (IOPS was half what it’s showing in chart).
Anyone know for sure what’s going on? Should I just increase the IOPS more?