Hi,
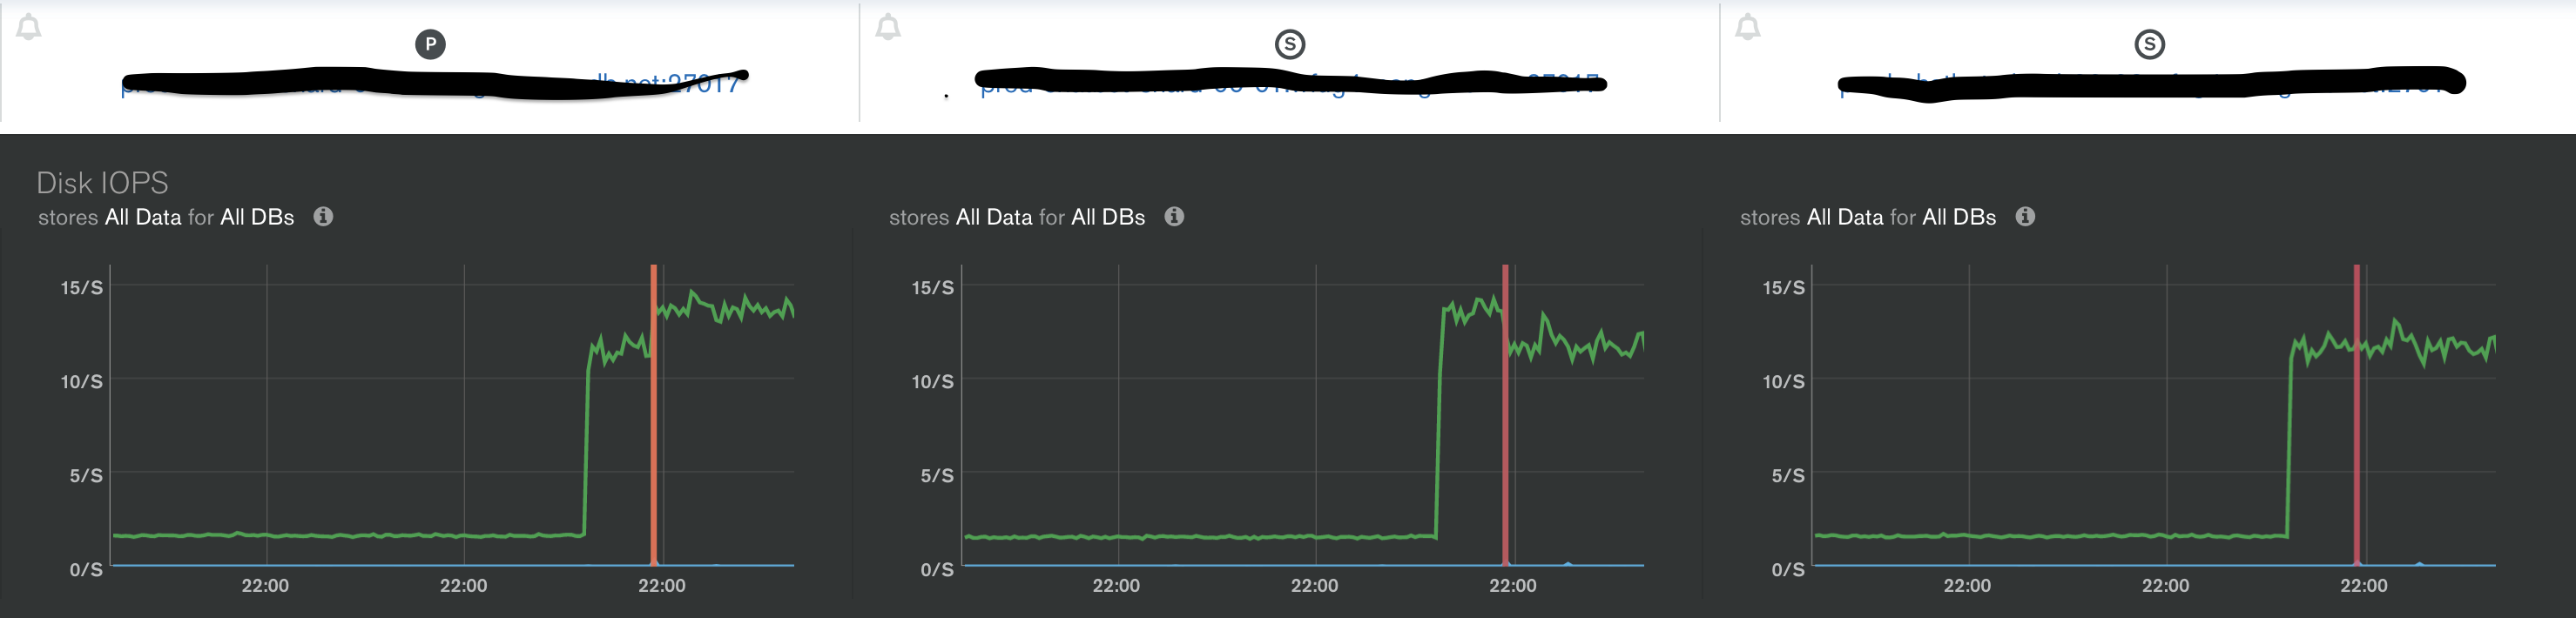
We have a MongoDB Atlas (Version 4.0.25 + M20) with 1 primary and 2 secondaries. Since 2 days ago we have faced an increase in system write IOPS both in the primary and secondary nodes. As we are still well below the 2000 IOPS which is configured for our cluster I don’t understand why we are facing this increment.
How could we fix this IOPS issue?
Regards
1 Like
Hi @Mario_Martinez1 and welcome in the MongoDB Community  !
!
First of all, if you think there is a problem with the platform and it’s not something you are doing, don’t hesitate to contact the support in the bottom right corner or with the support link at the top in Atlas.
IOPS means that you are using the disk (Captain Obvious… I know!). I guess you have the usual read & write amount of operations per minutes you are used to. So of course, your write operations generate a certain “baseline” of IOPS on your disks. Nothing we can really do here.
But the read operations, it’s a very different story. When you try to access data from your data set, MongoDB will first look if the document is in the RAM, and if it’s not, it will fetch it on disk (trying to keep it simple…). So read IOPS can be avoided if you have more RAM and if you don’t evict too often documents that are part of your working set.
If your read queries sometimes run ad hoc queries that access “unusual documents” (meaning docs outside of the working set - docs from 2019 for example), then it means that you will have to evict useful docs from your RAM for these old docs and generate a lot of IOPS to answer these queries. After that, the opposite happens: evicting from RAM the 2019 docs to load the recent docs once you are back on your normal workload.
That’s why analytics workload are usually handled on a specific node to avoid impacting the prod workload.
I’m not saying that this is what is happening here. But lack of RAM could be a reason for high IOPS.
Cheers,
Maxime.
1 Like
Hi @MaBeuLux88_xxx ! Thank you 
I already contacted MongoDB support but as this is a Root Cause Analysis it is out of scope from the free support. And that’s why I decided to create a topic here (Also recommended by the support).
The read IOPS are almost at 0 ops/s but the write ones suddenly changed from 0 to 12 ops/s. I know it is not a lot but I wanted to understand why (we didn’t deploy any change that day) and how we could fix it. I also was curious about it because this happened both in the primary and secondary nodes.
Regards
Mario
It’s not the replication (oplog moving forward + replication on the secondaries) or some writes coming from your client applications?
MongoDB write requests and Document writes are the same. It just changes the write IOPS.
And we haven’t received an increase in traffic or deployed changes lately.
I’m short on ideas then  . No idea. Maybe someone else will have an idea.
Hello, @Mario_Martinez1 we are facing the same issue. Out of the blue, MongoDB started consuming write IOPS. There is nothing going on. It jumped from ~0 to 400/s stayed there for few hours then it dropped again. It appeared sporadically, maybe for few hours a month, then a week and now it stays in that state all the time. The data in that database are increasing steadily and it might be connected to that. But at that time we are not doing anything on the machine, really and this state doesn’t worsen when the machine is under heavy load. Did you manage to resolve the problem of yours? Our mongodb is on premise.