Hi,
I am using the Grafana plugin grafana-mongodb-atlas-datasource to view MongoDB Atlas metrics in Grafana. However, I am encountering the following error:
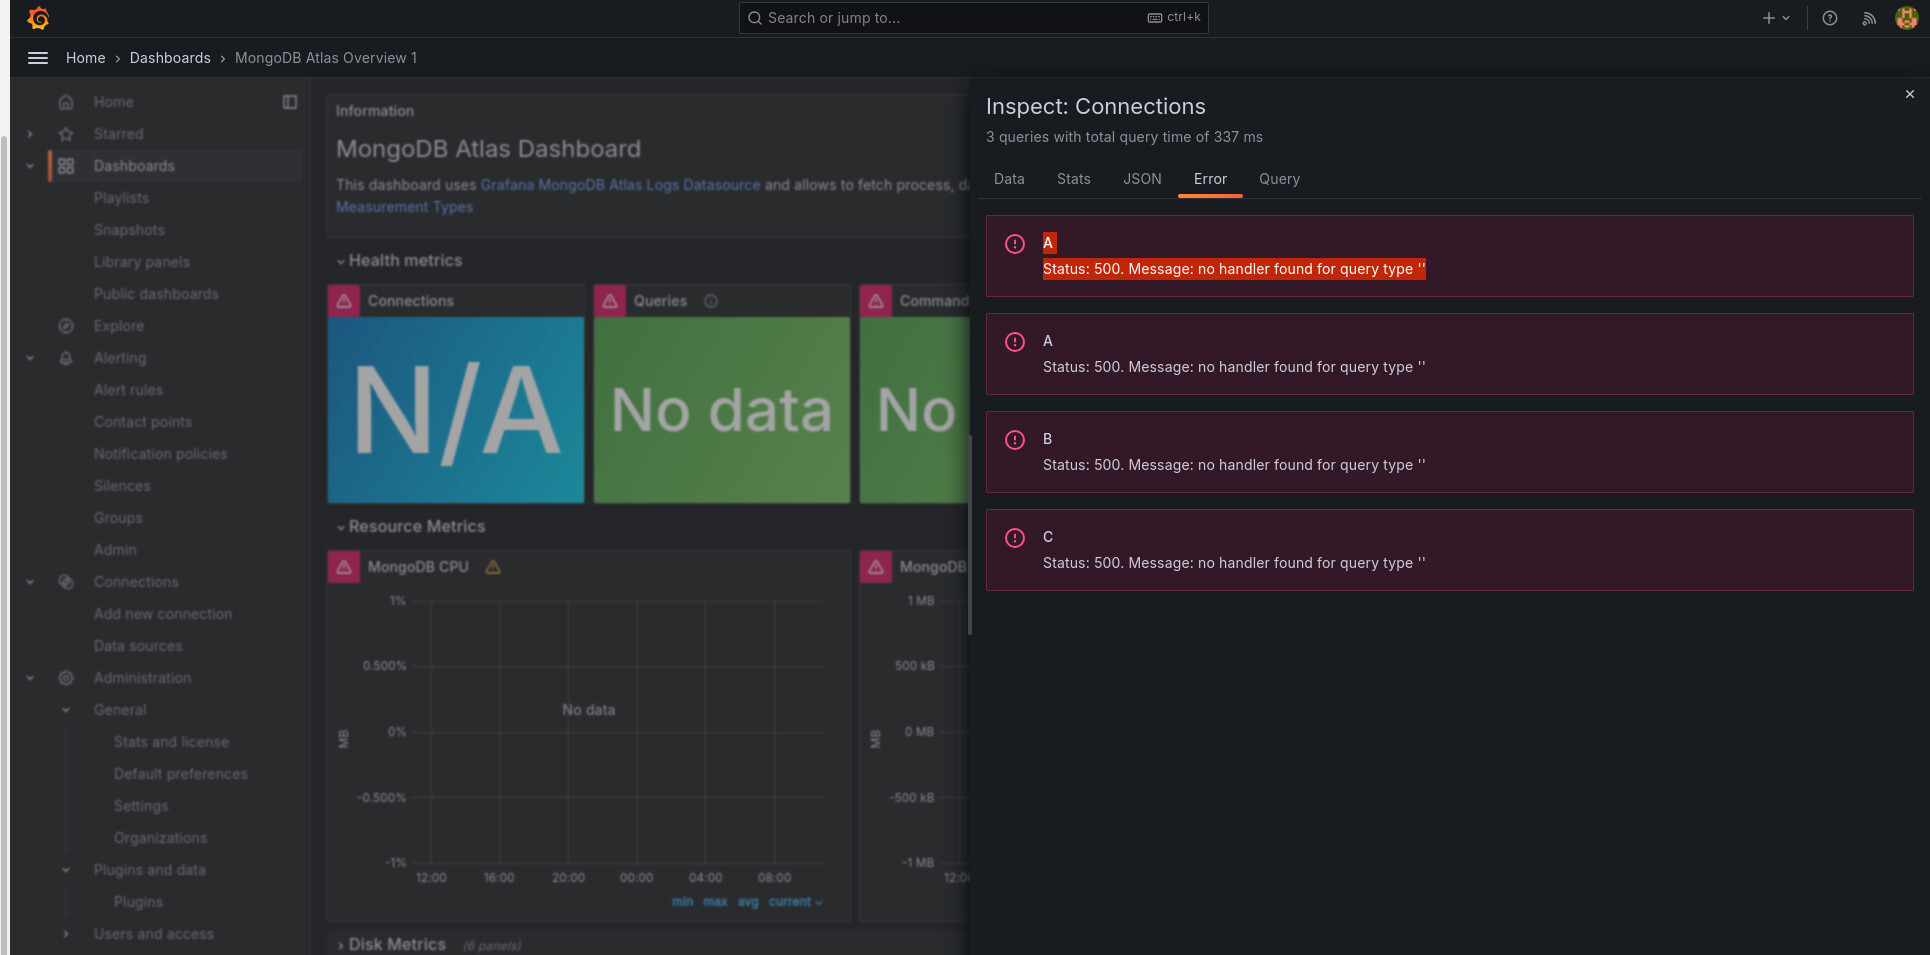
Status: 500. Message: no handler found for query type ''.
Welcome to the MongoDB community! I’m not too familiar with the Grafana plugin you linked. However, we do have a few grafana dashboard templates that I’ve attached below which you may find helpful.
This error seems to be an issue w/ the datasource in Grafana OSS.
I believe you will need to change the datasource in Grafana to “prometheus” rather than “grafana”.