Mongo Server Version - v6.0.9
Mongo Client Version - v1.6.0
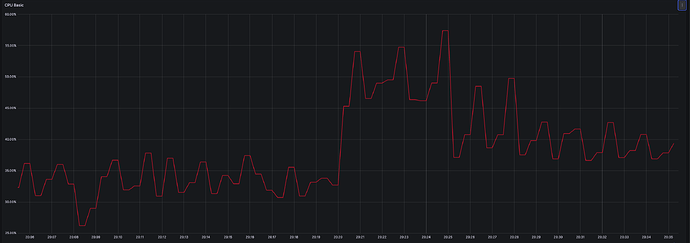
We have a workload which is insert & update heavy with also good number of reads. We see sudden increase in CPU usage as seen in the below screenshot during peak hours of operation
During the same time we also see this log, which indicates extremely high number of locks being acquired.
{“t”:{“$date”:“2024-07-11T20:21:55.034+05:30”},“s”:“I”, “c”:“COMMAND”, “id”:51803, “ctx”:“LogicalSessionCacheRefresh”,“msg”:“Slow query”,“attr”:{“type”:“command”,“ns”:“config.$cmd”,“command”:{“delete”:“system.sessions”,“ordered”:false,“writeConcern”:{“w”:“majority”,“wtimeout”:15000},“$db”:“config”},“numYields”:0,“reslen”:230,“locks”:{“ParallelBatchWriterMode”:{“acquireCount”:{“r”:28297}},“FeatureCompatibilityVersion”:{“acquireCount”:{“r”:35,“w”:28297}},“ReplicationStateTransition”:{“acquireCount”:{“w”:28301}},“Global”:{“acquireCount”:{“r”:35,“w”:28297}},“Database”:{“acquireCount”:{“r”:3,“w”:28297}},“Collection”:{“acquireCount”:{“r”:3,“w”:28297}},“Mutex”:{“acquireCount”:{“r”:28298}}},“flowControl”:{“acquireCount”:28296,“timeAcquiringMicros”:26364},“writeConcern”:{“w”:“majority”,“wtimeout”:15000,“provenance”:“clientSupplied”},“waitForWriteConcernDurationMillis”:6,“storage”:{“data”:{“bytesRead”:223}},“protocol”:“op_msg”,“durationMillis”:14}}
Around the same time we also see a spike in this metric
mongodb_ss_wt_lock_txn_global_lock_application_thread_time_waiting_usecs
Could these high number of locks acquired be leading to high CPU usage? If yes, what could be the reason to acquire so many locks on system.sessions collection?

