Hello, I’m having problems filtering date using Atlas Charts.
Let me show you what I’m talking about…
I have chart above showing how many Gains and Losses we had today.
In my collection I have a field named “result” which is filled with “gain” or “loss”, and I’m using an aggregation count with this field.
But I need to show only documents which was inserted today, so I was filtering like this:
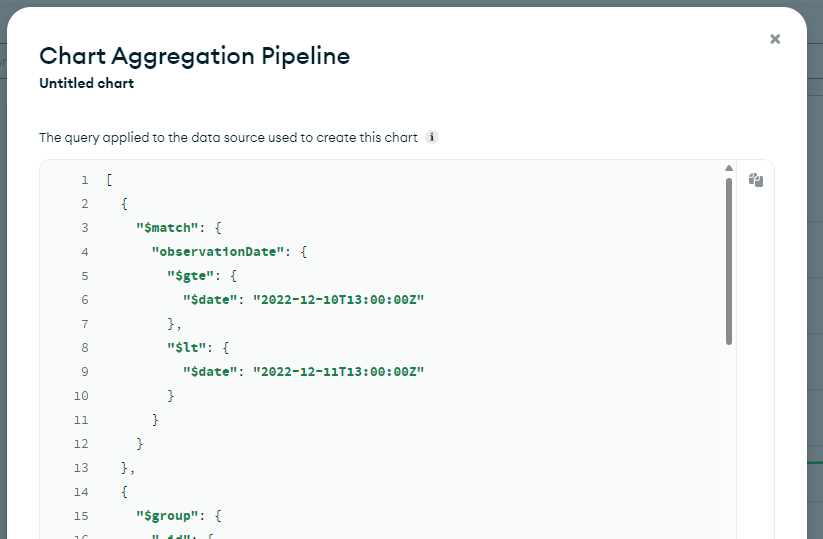
Filtering Date on the Chart (Image)
As we can see I have a field named “created_at” with the date, and I set the UTC Time Zone as UTC-03:00
I’m using python (pymongo) to fill my collections and to fill the “created_at” field I used the package datetime and function datetime.now()
I verified these fields and the date are correct and they’re using my local time (UTC-03:00 Brasilia)
created_at: 2022-12-10T00:25:23.273+00:00
PS: It’s a date field, not string field.
But, the problem is…
Today’s count is wrong on the chart! Counting manually we see that we have 26 LOSSES, but on the chart it appears 23
I used the following filter and count manually looking at the date:
Filtering my Collection to count manually (Image)
Probably the gain is incorrect too but I used losses for example to make it easier to count manually.
Is it a problem on the chart filtering date? What can I do to show only today’s document?
@edit:
If I change the filter to Absolute and fill with today’s date, it WORKS, but i don’t want to have to change the filter everyday.
