Investigating Occasional Low WiredTiger Read Ticket Availability

Hi -

I’d like to solicit feedback about an issue we’re experiencing on a self-hosted mongo cluster.

Occasionally, the application that depends on this 3 node mongo cluster will experience high levels of latency which we have correlated with a sudden drop in available read tickets. As seen in the screenshot below, this also happens after a spike in new connections, all while CPU, memory, and disk metrics remain relatively stable.

Do you have any suggestions about what we should investigate to help with this issue?

mongodb version: 4.0.16
application: go
application version: 1.16
mongo driver: globalsign/mgo
mongo driver version: v0.0.0-20181015135952-eeefdecb41b8

Thanks for your time!

Hi @a_ins,

Welcome to the MongoDB Community forums :sparkles:

From my observations between the time frame of 16:06 and 16:07, there was a significant fluctuation in the number of tickets available, going from 120 or more to zero and then back up to 120 or more within a span of 30 seconds. At the same time, there was an increase in the number of connections, which rose from 0.5K to 1.7K, representing a three-fold increase.

I believe this is working as intended, and not really an issue from the server side, but rather a design feature of WiredTiger to prevent it from being overwhelmed and thus having difficulty servicing the work assigned to it. The decrease in available read/write tickets indicates that the number of concurrent running operations has reached the configured read/write values, which means that any additional functions must wait until one of the running threads finishes its work on the storage engine.

In the majority of cases, a drop in the number of reads/write tickets is an indication of an increase in load or slow performance, such as slow hardware or poorly-indexed queries, causing operations to run for much longer than expected, leading to an increase in latency. However, in this instance, I think it’s the flood of incoming connections and concurrent operation and this is the correlation due to that. From the graphs you posted, though, it seems that WiredTiger was able to process all work within 30 seconds.

Let us know if you have any further questions.

Best,
Kushagra

1 Like

Thank you for the response Kushagra, this was helpful to see.

I’ll be going back to my team for more input.

This doc explains a bit on the concepts.

Those increased number connections must have been causing high latency on some queries. I believe in modern world there’s no one to one mapping from connection to thread on the server. If all queries run fast enough, even a single thread is able to handle all of them (e.g. redis). So some queries must take long to finish.

You can also check query latency graph during that window.

on the other hand, if number of connection is indeed the root cause , you can consider adding a proxy in front of mongodb servers (if this is not done yet). Many proxy servers can employ a connection pool with backend servers to limit the connection number. (e.g. proxySQL for mysql).

1 Like

Hi all, I’m @a_ins’s coworker and I can add a little more detail to our issue. It’s a bit baffling and we’d definitely appreciate guidance from those with more specific Mongo experience.

This has been a recurring incident in which database response times and query run times spike. Queries that normally take tens of ms take several seconds. Read tickets drop and the cluster effectively locks up for a while. Then it eventually seems to work itself free and resume normal operation. The drop in read tickets occurs on both reader nodes, though sometimes one occurs before the other by seconds or minutes.

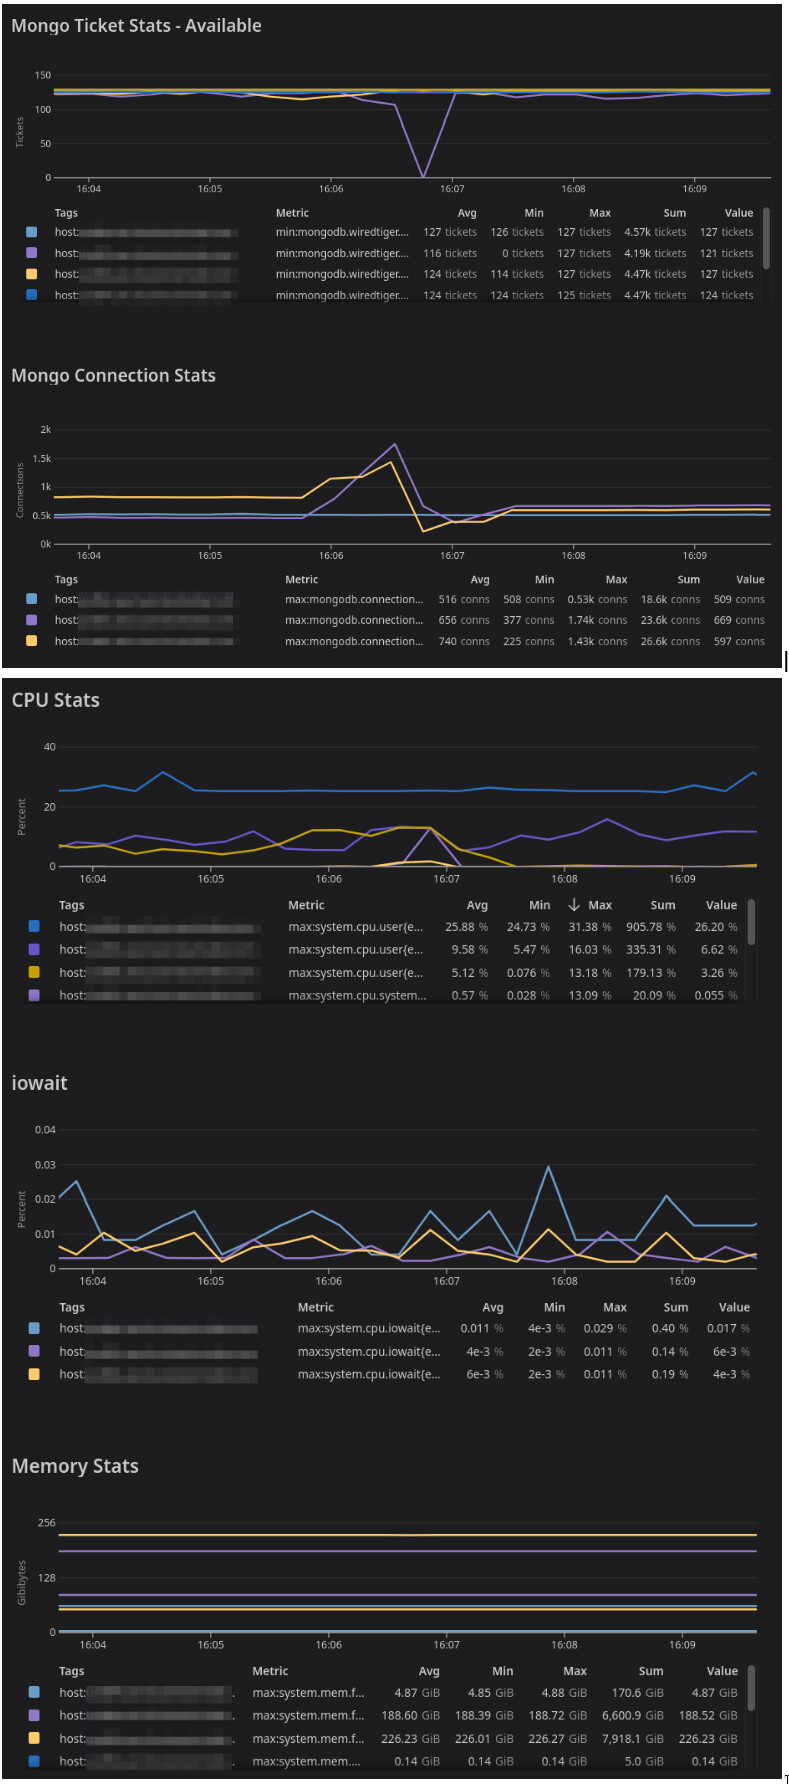
Connections do seem to spike, but I’ve found at least one incident where connections spiked after the drop in read tickets. The drop preceded the spike.

We definitely have some poorly optimized queries and indexes, and in the incident where tickets dropped prior to the connection spike there was an increase in documents returned and in unindexed queries. However, in other incidents we don’t see that.

If it was simply a slow query or queries, I wouldn’t expect it to consistently impact both readers in this way. And, while I’m still getting up to speed on the issues, my understanding of previous investigations is that there doesn’t appear to be a consistent pattern to the queries running during these incidents.

This really looks like a resource contention issue to me. My understanding of read tickets dropping to zero is that it’s usually a symptom of some other resource bottleneck that’s causing queries to hang on to read tickets for longer than usual, resulting in tickets getting used up and queries queuing. Is this an accurate understanding? Are there other potential root causes of read tickets dropping?

I struggle to think of a database scenario that should cause the whole database to lock up with out some sort of resource contention - but, granted, I’m far more experienced with relational databases than Mongo or NoSQL. And we haven’t come any where near any of our resource limits - like @a_ins said: CPU, disk, memory all look fine. We’ve got the readers on huge boxes and Mongo’s nowhere near the limits. Is it possible there’s some sort of internal resource limit preventing Mongo 4 from using all the resources on the boxes? Our writer is on a much smaller box - is it possible the resources available to the writer are limiting the readers in some way?

Is this something a poorly written or indexed query could cause: a complete lock up of the cluster with out apparent resource contention?

We’d definitely appreciate any thoughts or guidance!

Hi :wave: @Daniel_Bingham,

Firstly, it’s important to note that the WT ticket is a purely reactive mechanism that responds to how much work is being processed and incoming work, to prevent WiredTiger from having too much work backlog and making the situation worse. This means that if the workload is very high, the WT ticket will react to that.

There are a few possible causes of performance issues previously mentioned, such as slow queries and underprovisioned hardware. However, if all the metrics appear to be fine, it’s possible that we are looking at metrics that are not showing the actual bottleneck. It’s important to investigate further and consider other potential causes.

In terms of resource contention, can I ask what makes you think that this could be the cause?

However, it’s worth noting that there are no artificial limitations on resources from the MongoDB server side. In fact, MongoDB will try to use all available resources in order to provide the best possible performance. This is why running multiple mongod instances on a single node is discouraged, as it can lead to resource contention.

Another possible cause of performance issues could be poorly written or indexed queries. If a query is not optimized, and you have many of them simultaneously, they could be holding read tickets for an extended amount of time, reducing the number of available tickets for incoming work. It’s worth checking the logs for any slow queries and investigating whether they could be the cause.

Best,
Kushagra

@Daniel_Bingham @a_ins

My cluster is experiencing the same issue.
How did you resolve the issue?
Any input is appreciated!