Hi, I am hoping to create a daily chart and hourly chart of progress of installation with MongoDB Charts. Below is a sample object copied from MongoDB:
There are two main features you need to use to do what you want: date binning and period filters.
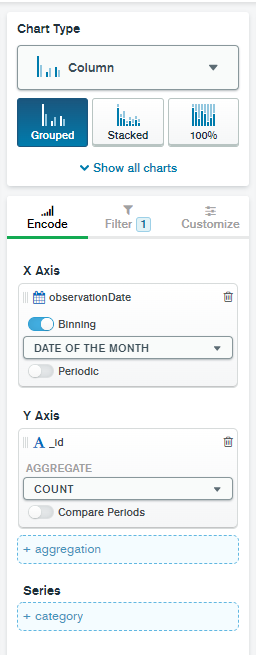
For both your daily and hourly charts, you should encode the date field you want (probably installedOn) on your category axis, and choose the appropriate binning period, e.g;
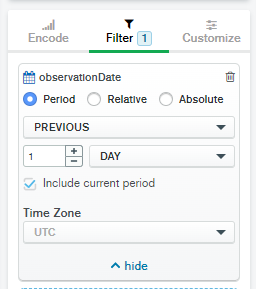
On the Filters tab, you can create a filter from the same date field. The “Period” filter type automatically selects the start of the period (e.g. each day or each month). This is in contrast to the “sliding window” behaviour you get if you use the “Relative” filter type.
Unfortunately there is not currently a way of automatically inserting the current date into the chart title.