In MongoDB 5.0.9 ,TTL Index is not working

What’s up everyone.
I recently encountered an issue where in a MongoDB service, all TTL indexes for collections are not effective。
It is determined through the following method:

db.serverStatus().metrics.ttl
{
        "deletedDocuments" : NumberLong(1487129845),
        "passes" : NumberLong(505811)
}
The 'deletedDocuments' field and  'passes'  field has not changed in the past two days
db.adminCommand({getParameter:1, ttlMonitorSleepSecs: 1});
{
        "ttlMonitorSleepSecs" : 60,
        "ok" : 1,
        "$clusterTime" : {
                "clusterTime" : Timestamp(1729051195, 84),
                "signature" : {
                        "hash" : BinData(0,"vizbZrZFo2Y7Gpj2ZDb0oxNbSTw="),
                        "keyId" : NumberLong("7366182217619341331")
                }
        },
        "operationTime" : Timestamp(1729051195, 84)
}

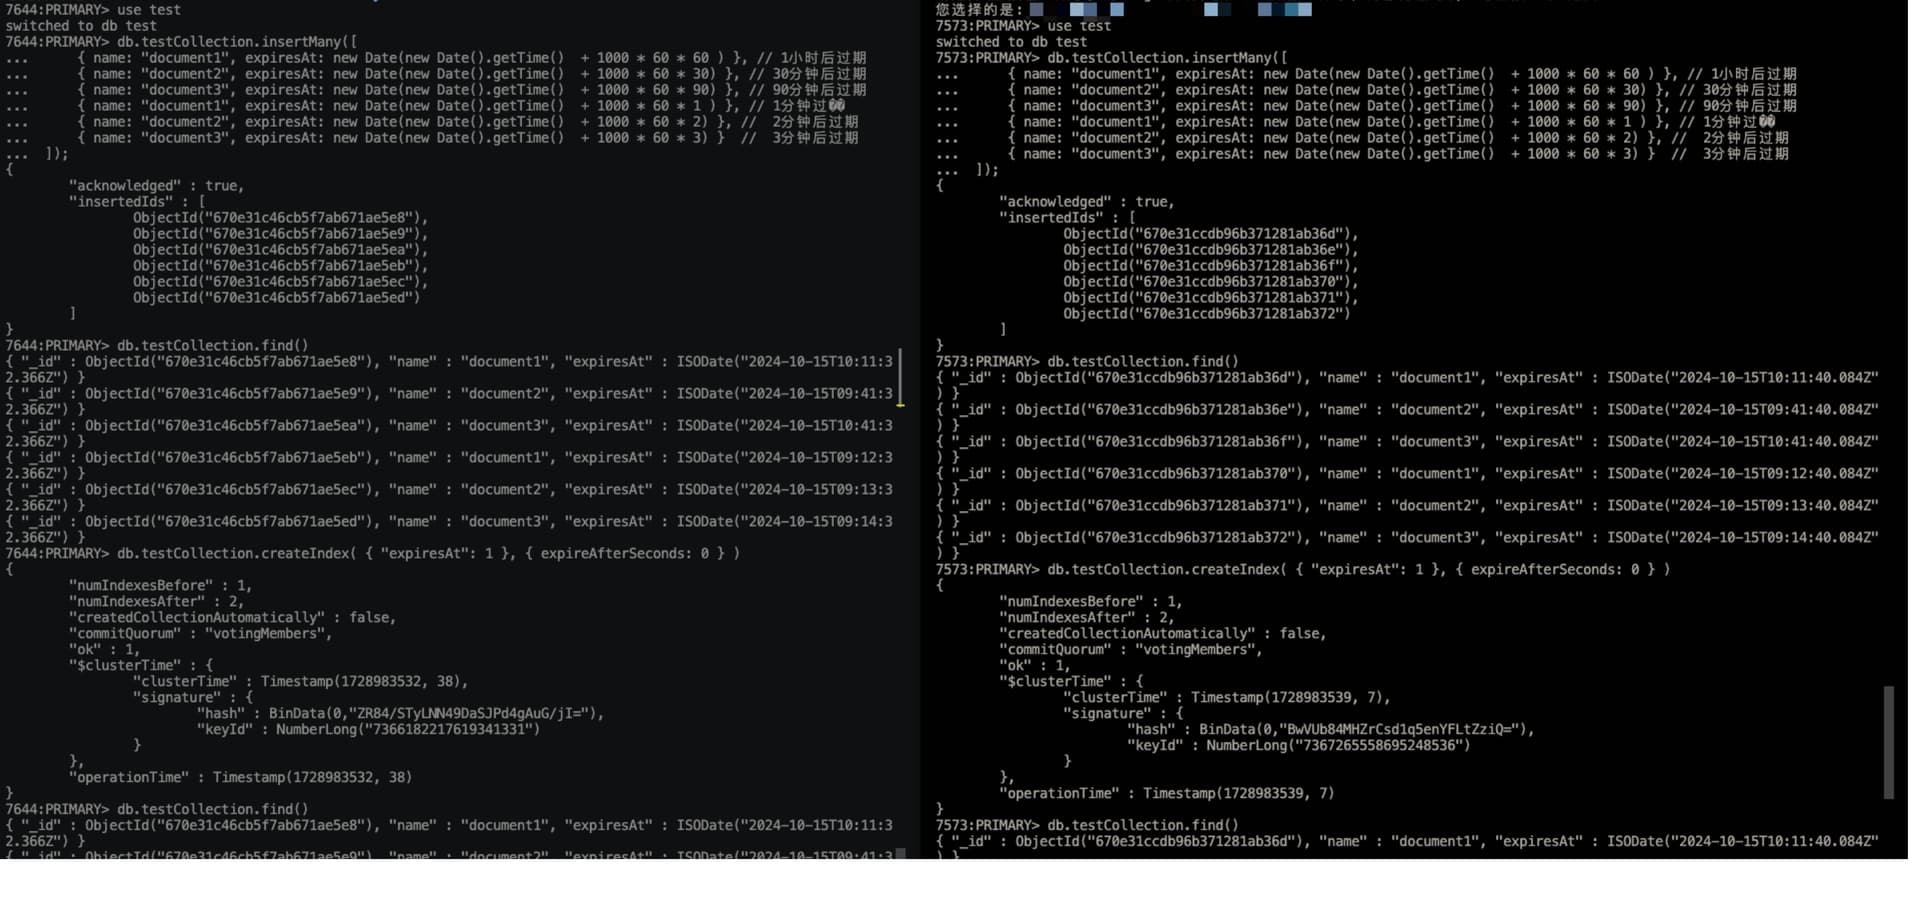
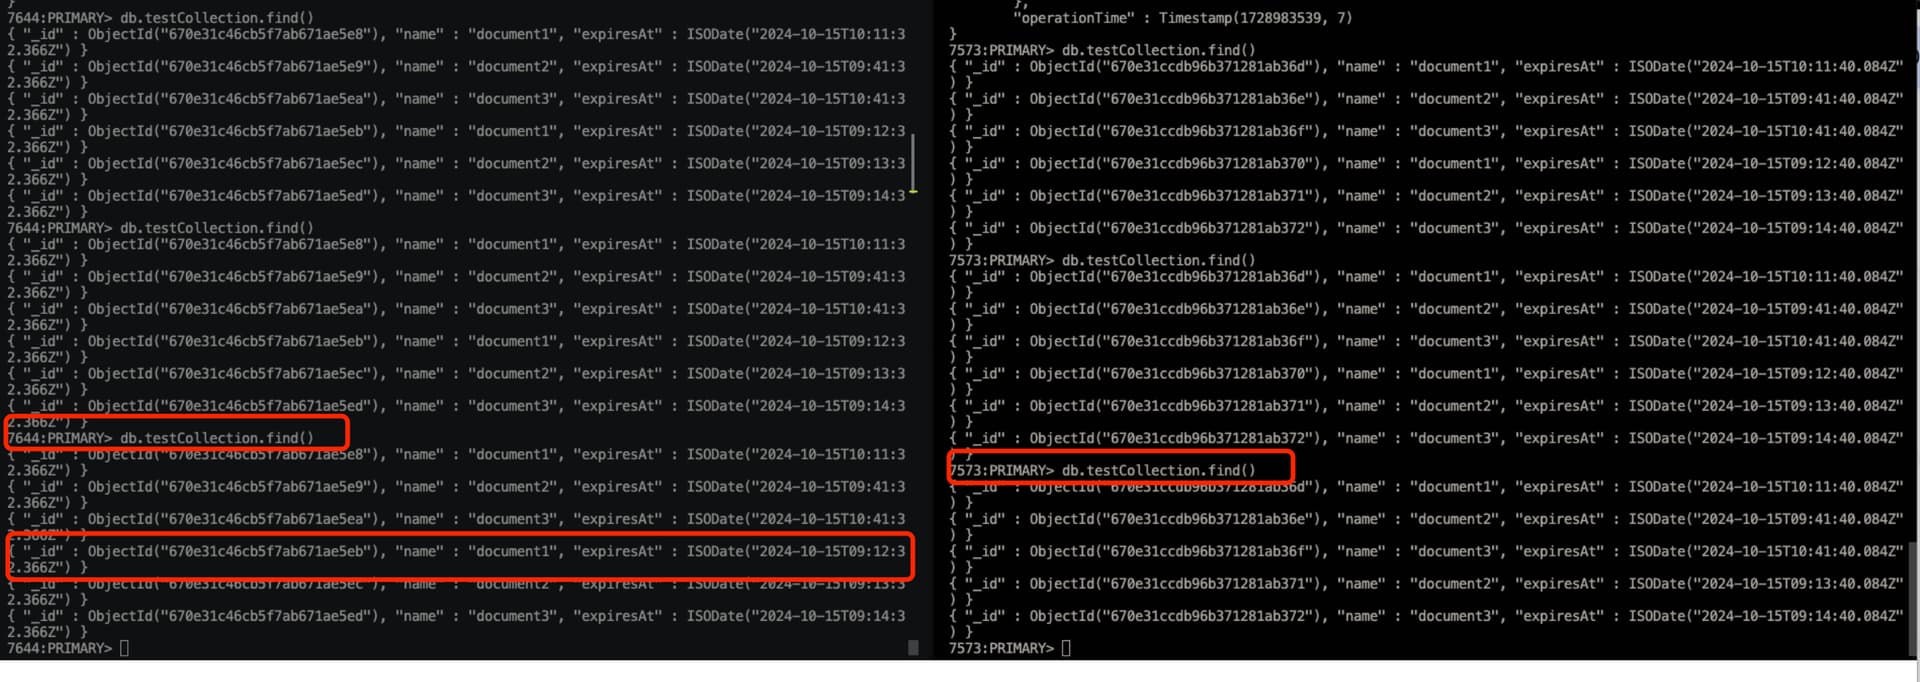
I did some tests. In two identical versions of MongoDB services, the same database and collections were created, the same data was inserted, and the same indexes were created. The problematic service and expired data were not cleaned up, but the normal service and expired data were cleaned up normally. Refer to the following diagram for testing steps


Hi @Siting_Yang

Upgrade to the latest 5.0.29 and see if the issue persists. Admitted likely not the issue as two of the same version have been tested by you.

Check if the TTLMonitor is enabled:

test> db.adminCommand({getParameter:1,ttlMonitorEnabled:1})
{ ttlMonitorEnabled: true, ok: 1 }

Are there any other ttlIndexes on the problem server? TTL indexes on descending indexes are known to be very slow on versions < 7.0

And of course try restarting the mongod.

Hi @chris ,
I executed this command and checked that TTLMonitor is enabled

 db.adminCommand({getParameter:1, ttlMonitorEnabled:1})
{
  ttlMonitorEnabled: true,
  ok: 1,
  '$clusterTime': {
    clusterTime: Timestamp({ t: 1729152514, i: 71 }),
    signature: {
      hash: Binary(Buffer.from("c9b2d0179137db230da7cd723df3fa0ffd3bc198", "hex"), 0),
      keyId: Long("7366182217619341331")
    }
  },
  operationTime: Timestamp({ t: 1729152514, i: 71 })
}

Through service monitoring, I found that the db.serverStatus().metrics.ttl.passes field of the primary node in this cluster has not changed, but there has been a change in the db.serverStatus().metrics.ttl.passes field of the secondary node.
Therefore, I performed a master-slave switch on the cluster.
Within about ten minutes after the switch, the TTL index took effect, but after ten minutes, the db.serverStatus().metrics.ttl.passes of the new master did not change either, and the passes field of the secondary node changed. After testing again, the TTL index on the new master did not take effect again.
It seems like the primary node in the cluster ,TTL Monitor Thread had some problem

The following is an image of TTL monitoring, featuring values from the db.serverStatus().metrics.ttl object’s deletedDocuments and passes fields.