Hi, I am using ChartsEmbedSDK to embed a chart I have created using authenticated JWT token. In MongoDB atlas, I have entered an aggregate query in the query bar to pre-process data.
Now, while embedding the chart, the aggregate query has some dynamic values which I want to pass from my app. I could not get the reference to this use-case anywhere in documentation so I tried passing aggregate query in the filter key.
This is my code:
this.sdk = new ChartsEmbedSDK({
      baseUrl: 'BASE_URL',
      height: 500,
      filter: [{
		$match: matchQuery }
	}, {
		$unwind: unwindQuery
	}, {
		$project: projectQuery
	}, {
		$group: groupQuery
	}],
      getUserToken: () => {
        return token
      }
    });

    this.chart = this.sdk.createChart({
      chartId: 'CHART_ID'
    });

    this.chart.render(document.getElementById("element_id")).catch(() => window.alert('Chart failed to initialise'));
I have added the field inside $match query in the User Specified filters in Authenticated Embed chart.
But, I am still getting this error: Error loading data for this chart (error code: 7). User filter is not allowed.
Hi @Rahul_Chouhan1,
Welcome to MongoDB community.
I don’t think you can pass an aggregation pipeline as a filter.
The way to try and do that is to use a pipeline in your data source and build the data in a way that you pass field filtering as a plain simple query.
Thanks
Pavel
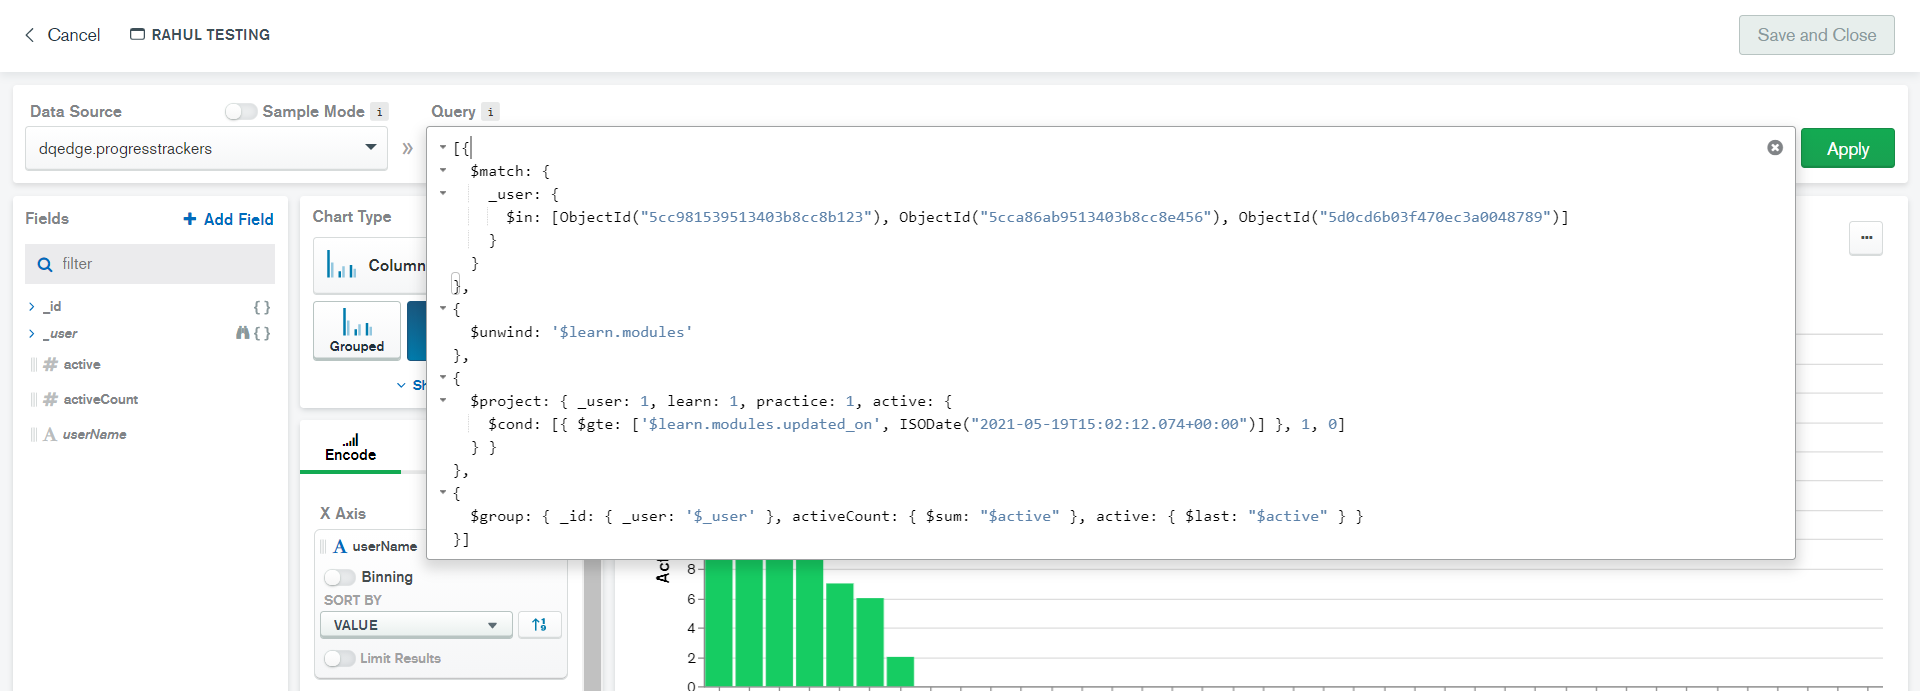
This is how I am processing my data in charts.
Now, if I write this aggregate query in the pipeline in the data source as you suggested, I need to pass an array of ObjectIds as you can see in the image, like this
_user: { $in: [ObjectID1, ObjectID2, ...] }
So, the problem is
- How do I write query in pipeline so that I can take the array of ObjectIDs as an input?
- How do I pass the same input from the SDK?
- Can I perform all the operations shown in image (
$match, $unwind, $project, $group, $in, $cond, $gte, $sum, $last) because none of them is mentioned in this documentation Data Source Pipelines?
It will be really helpful if you explain with an example.
Hi @Rahul_Chouhan1 -
Right now there are a few limitations in what you can do here:
- With the embedding SDK, you can only pass in a filter (which is wrapped in a
$match stage), no other stages can be injected.
- The full aggregation pipeline is generated in a specific order as documented at Backing Aggregation Pipeline — MongoDB Charts
This means that while it is possible for you to pass in your ObjectID query through the SDK, it will be inserted after the query bar query, the $project and $group stages will execute before the filter (which probably isn’t what you want).
Grouping and projections are automatically generated when you encode fields, so perhaps you could find a way to make this work. We do realise the current behaviour can be limiting for advanced scenarios, and we hope to find ways to make it more flexible in the future.
Tom
1 Like
I just noticed that you can obtain the aggregation pipeline used by MongoDB Charts when you edit a chart, but what are you supposed to do with it, and more importantly could it be used to make the chart more dynamic (and not just in the future). Is it available now as a diagnostic only? This is more just for curiosity than anything practical.
[{$match: {
 borough: 'Manhattan',
 cuisine: {
  $in: [
   'Mexican',
   'Japanese',
   'Thai',
   'Southwestern',
   'Steak',
   'Soups',
   'Tapas'
  ]
 }
}}, {$group: {
 _id: {
  __alias_0: '$geometry',
  __alias_1: '$name',
  __alias_2: '$cuisine'
 }
}}, {$project: {
 _id: 0,
 __alias_0: '$_id.__alias_0',
 __alias_1: '$_id.__alias_1',
 __alias_2: '$_id.__alias_2'
}}, {$project: {
 geopoint: '$__alias_0',
 detail: '$__alias_1',
 color: '$__alias_2',
 _id: 0
}}, {$match: {
 'geopoint.type': 'Point',
 'geopoint.coordinates': {
  $type: 'array'
 },
 'geopoint.coordinates.0': {
  $type: 'number',
  $ne: {
   $numberDouble: 'NaN'
  },
  $gte: -180,
  $lte: 180
 },
 'geopoint.coordinates.1': {
  $type: 'number',
  $ne: {
   $numberDouble: 'NaN'
  },
  $gte: -90,
  $lte: 90
 }
}}, {$limit: 1000}]
1 Like
Hi @Ilan_Toren -
Some people use the pipeline to diagnose why the chart is showing the data it is, or as an educational tool to learn more about the aggregation framework. Advanced users may also want to copy and paste the pipeline into the chart query bar, so they can make their own tweaks to the pipeline.
There isn’t currently any way of programmatically modifying a chart’s pipeline, although we are thinking about some of these scenarios. If you have any specific suggestions on what you’d like to see, feel free to suggest them here or in the MongoDB Feedback Engine.
Tom
1 Like
We re-use the exposed aggregation pipeline in our back end as the basis for a full export of the resulting data. This is helpful when the chart can only reasonably display 20-30 rows of data without becoming too crowded. Our customers can then do what they want with the full data set.