OK All, I see similar posts have been made a number of times but my question does not seem to be answered in any of those threads.
I have the usual Query Targeting error, I get it at least daily, BUT, the profiler shows nothing and it notes that only “slow” operations are shown.
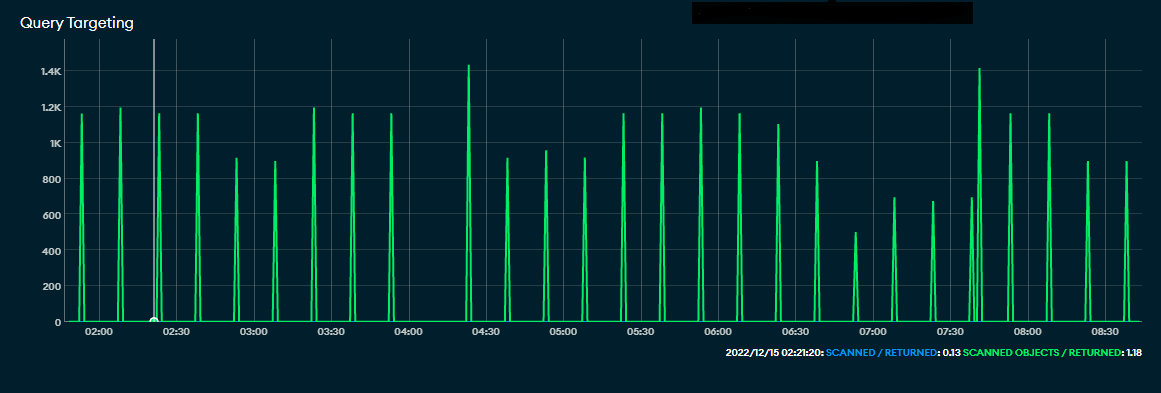
Looking at the status graphs for my clusters I can see it is happening a lot.
BUT, what I cannot figure out for the life of me is what collections are causing the issue. Does anyone know of a way to isolate that information? Or any other more advanced troubleshooting than a) check the profiler b) check the metrics or c) add an index
I added indexes to the collections I thought might be the issue but the problem if anything seemed to get worse. So I am at a loss.