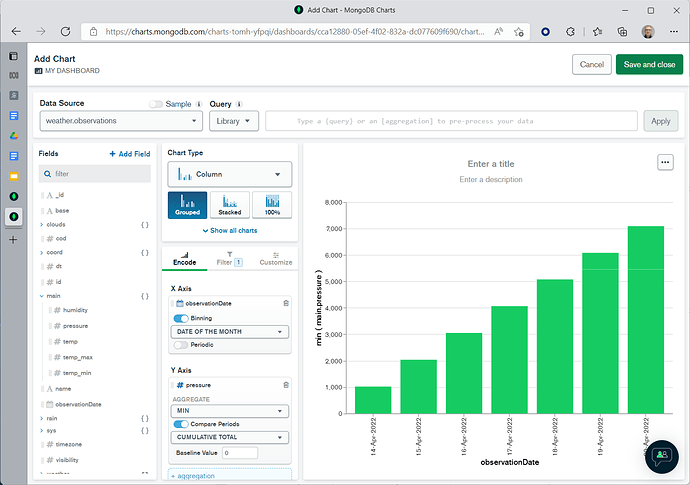
Hi, guys! I have an issue and I hope you can help me.
Basically I need to create a chart that subtracts an attribute of the last and first documents to get the difference between both. This simple scenario I solved with the following pipeline:
[{$project: {
 _id: 1,
 dhRelatorio: 1,
 todos_estudantes_x_uniao: {
  $filter: {
   input: '$todos_estudantes_x_uniao.por_uniao',
   as: 'uniao',
   cond: {
    $eq: [
     '$$uniao.uniao',
     'UCB'
    ]
   }
  }
 }
}}, {$project: {
 _id: 1,
 dhRelatorio: 1,
 indice_temp: {
  $arrayElemAt: [
   '$todos_estudantes_x_uniao',
   0
  ]
 }
}}, {$group: {
 _id: null,
 total_1: {
  $first: '$indice_temp.total'
 },
 total_2: {
  $last: '$indice_temp.total'
 }
}}, {$project: {
 total: {
  $subtract: [
   '$total_2',
   '$total_1'
  ]
 }
}}]
The problem is that the attribute “dhRelatorio” needs to be used as a filter, and to use this pipeline doesn’t allow to create this filter because the attribute isn’t returned.
As I said, basically I need to subtract an attribute of the last and first documents by date.
To comprehend better the attribute, it is a cumulative value per day, so if I sum all documents, the result will not be what I need. For example:
2022-01-01: 1000
2022-01-02: 1100
2022-01-03: 1200
If I sum these three “documents”, I’ll get 3300, but the value I need is 200 (2022-01-01 - 2022-01-03).
I don’t know if my idea is good and works, but I wanna create a pipeline that returns all documents, without filter, but that subtracts the attribute of the next and current document and replace the value of this attribute. Trying to exemplify my idea:
2022-01-01: 0
2022-01-02: 100
2022-01-03: 200
I hope you got it and can help me! Using my idea or a better one ![]()
