Hello @ken.chen
keyhole is a great tool to have a deeper view on the analytics data. In your blog post you mention a section called “metrics” (sacn_*) which can help to find e.g. missing or not fitting indexes. Unfortunately I do not see these metrics in Grafana. Is there anything special to do to retrieve and show these diagnostic data?
Via the mongod log we can find slow queries anyway, I am just curious how to get this to the Grafana view.
There is one more question: also in your blog you write briefly on some metrics what they can imply / tell. I tried to find further information like this specially for the wiredTiger metrics but did not found something useful. Do you know a source which you can share?
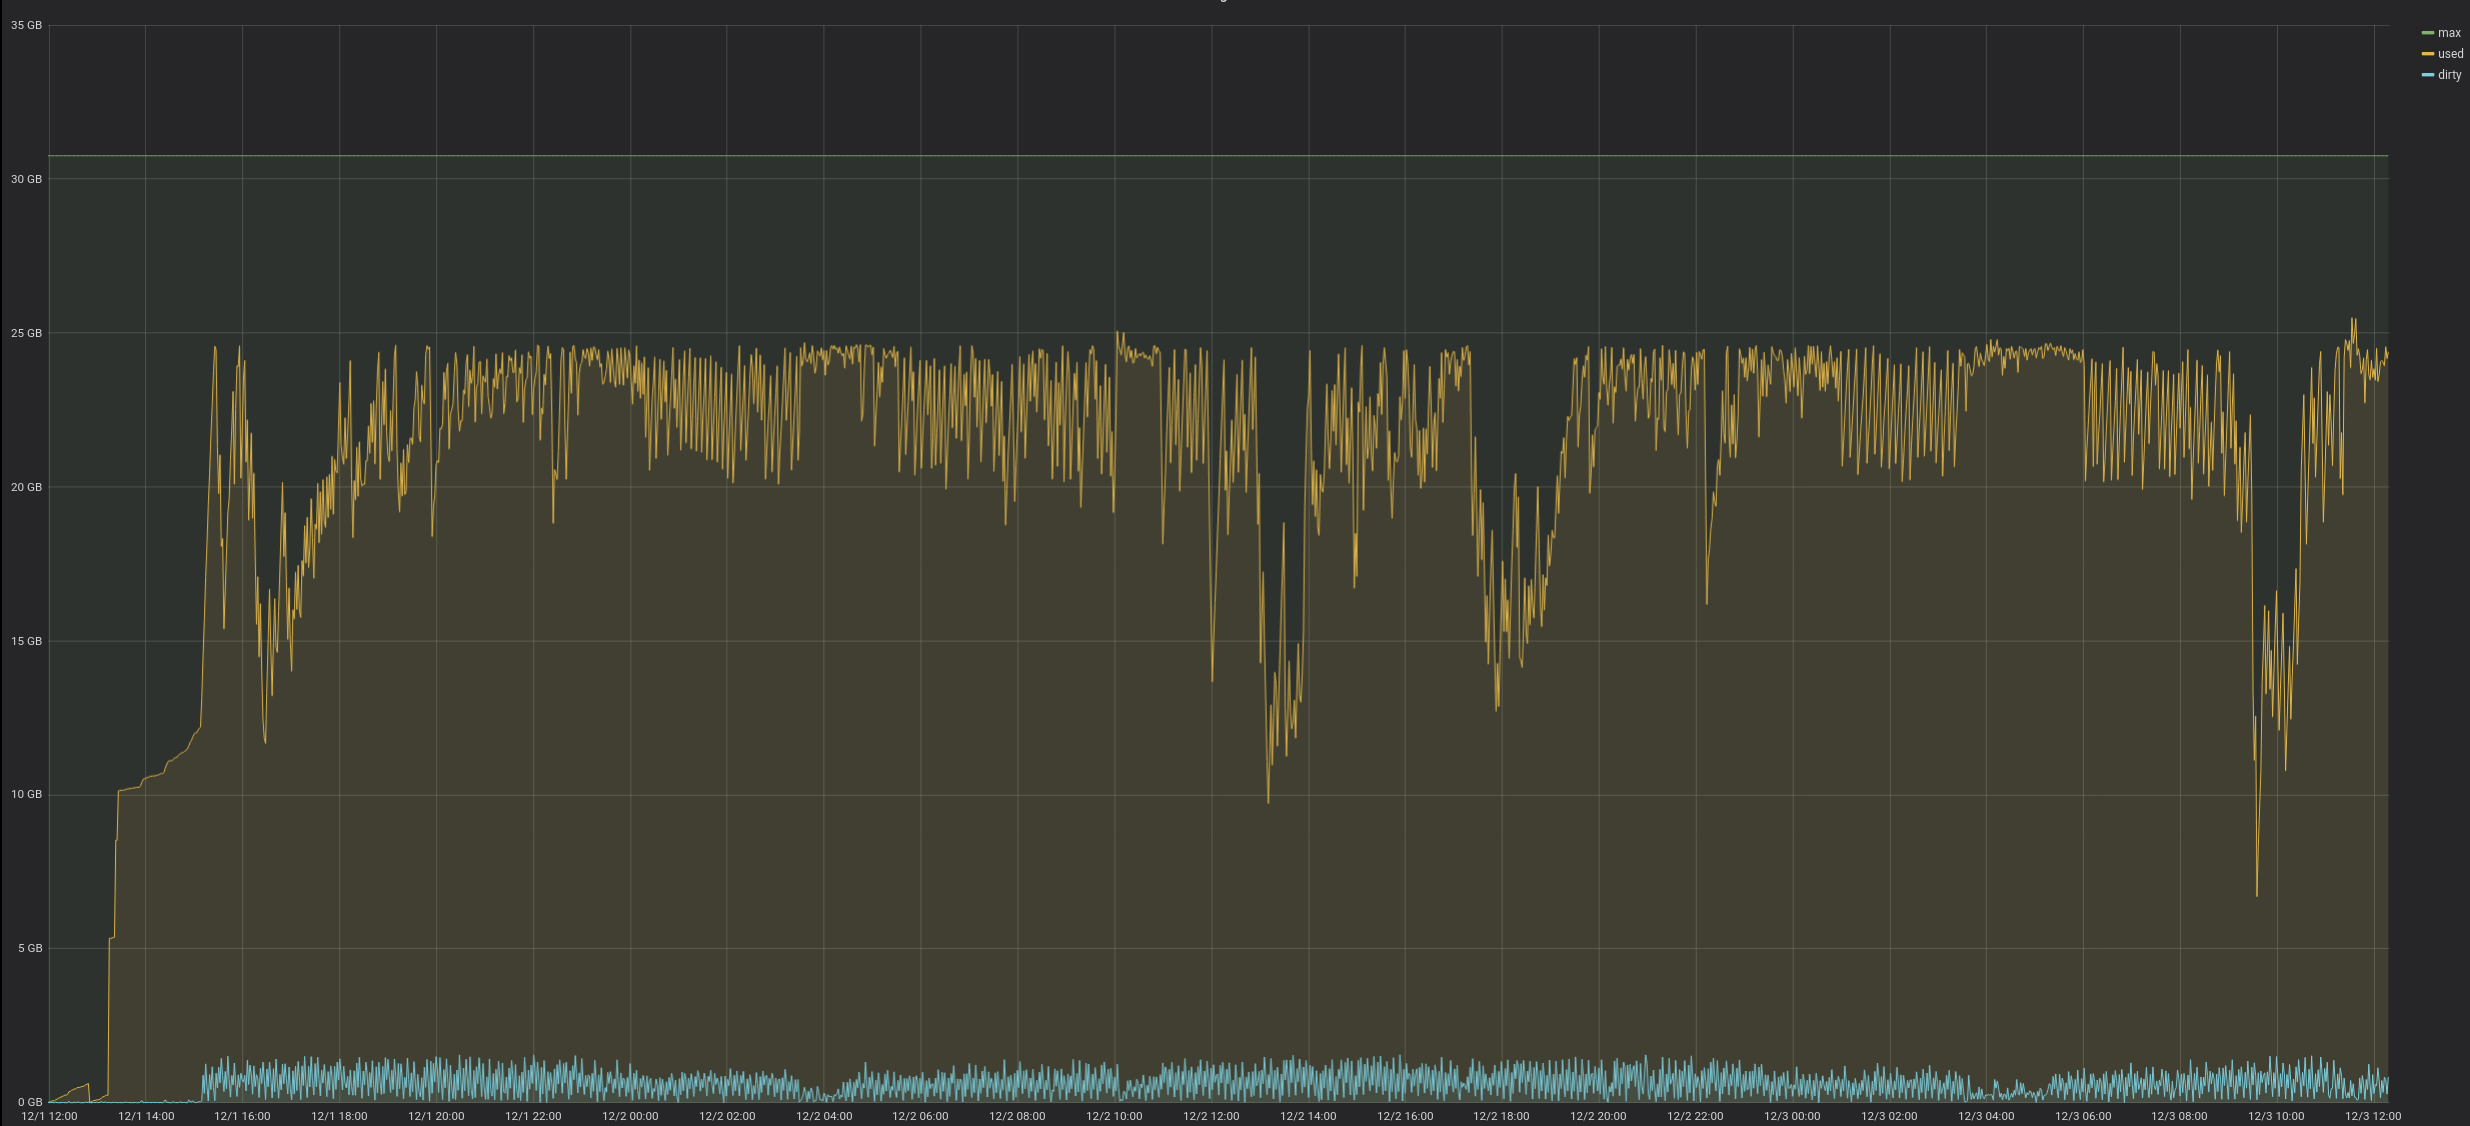
In practice: here is a system which starts after a while to have a constant amount of dirty cache. I would like to understand why.
Thanks a lot !
Michael