Hello
estimating how much RAM a MongoDB system will need is not an easy task, As a rule of thumb we have: size of all indexes plus number of all active documents multiplied with the average document size. So far so good.
But how can I verify any numbers when my system is up and running? How do I know when I reach limits?
Let’s do this by an example:
we have 128GB RAM
for simplicity all indexes take 23,5 GB
MongoDB will allocate per default 50 % of (RAM - 1GB), so we have in this example 63,5 GB RAM for MongoDB
63,5 GB minus 23,5 GB for the indexes will make 40 GB remaining for documents
from the mongod.log we get that the average document size is 4 MB
40 GB divided by 4 MB would mean to be able to have appr. max 10000 documents in RAM
Here comes the part I want to verify.
How system be checked is still doing well?
How to see that the documents are provided from RAM not from disk ?
How to get number of actively used documents? In the above example we could have 5000 documents used lately and 5000 documents which have been used long time before. I would take this as: all fine kind of 40% room to grow size indexes will grow too… How can this be measured?
How are “active documents” defined, which time frame do we us? I assume that this depends on the use case. In the line before I just mentioned “lately”
UPDATE
maybe the ration dirty RAM vs currently allocated RAM can be an indicator, but this would not deliver a warning, it can just alarm when it is already too late
on the other hand, on a higher level: it would be interesting to know the “age” of an document which is push out of RAM (the older the doc the more RAM is available for my active documents).
Anyone there who knows how to measure this?
The initial question could be rephrased as:
How to measure the minimal size needed for recent documents in cache?
So this is not like in the design phase where we estimate document sizes, connections, index sizes and try to get a feeling, this is about to measuring in a running system.
Hi…as per my knowledge after the Mongod process boots up, in addition to being the same as an ordinary process, it loads each binary and reliant library the memory, which serve as the DBMS. It must also be responsible for a large number of tasks such as client connection management, request processing, database metadata and storage engine. All of these tasks involve allocation and freeing up memory, and under default conditions the MongoDB uses Google tcmalloc as a memory allocator. The largest shares of the memory are occupied by “storage engine” and “customer terminal connection and request processing”.
Thank you for your input. These are valid points, I thing I should have worded it different.
How can I determine the size of active documents in the WiredTiger cache?
The WiredTiger cache will fill up over time but not all documents in the cache are “active” some might be old and just remain in cache. The critical part is when the WiredTiger cache is filled by the indexes and only active documents since then the system needs to start paging and this will be slow. I want to know before when it get’s critical.
If you or any reader has an idea how to get this number I’d be happy if you could share your knowledge with us.
You want to know how much of used memory is for “current” working sets.
You want to be able to tell if your “current” or “near future” working sets will fit in ram
Can you please elaborate on what info would lead you to conclude more RAM is needed?
The sections db.serverStatus().wiredTiger.capacity and db.serverStatus().wiredTiger.cache seem to contain metrics that will measure activity levels (recent / current) but they don’t necessarily mean “buy more ram” since this is related to working sets and expected future load.
So are you looking to get some reading of “current/recent working set sizes”?
You want to know how much of used memory is for “current” working sets.
Yes that is true. With “current” working sets = size of indexes + size of all actively used documents in memory
You want to be able to tell if your “current” or “near future” working sets will fit in ram
If my “current” working sets does not yet fit in to RAM I’d expect to see page faults. So it would be interesting to estimate something like the percentage of actively used documents of (cache capacity - index size)
sections db.serverStatus().wiredTiger.capacity
My playground is on version 3.4, .capacity was introduced in an later version
I also thought about looking on page eviction via db.serverStatus().wiredTiger.cache since: when an application approaches the maximum cache size, WiredTiger begins eviction to stop memory use from growing too large. But this will not help since I still can have not currently used data in the cache which fills it slowly up. So at some point we will reach the eviction_target and the worker will start evicting pages. But this still will not tell me the size of my “current” working set.
I am not a DBA so I may not get the meaning of all variables, may be I am looking into a false direction, I hope the above lines show what I mean.
keyhole is a great tool to have a deeper view on the analytics data. In your blog post you mention a section called “metrics” (sacn_*) which can help to find e.g. missing or not fitting indexes. Unfortunately I do not see these metrics in Grafana. Is there anything special to do to retrieve and show these diagnostic data?
Via the mongod log we can find slow queries anyway, I am just curious how to get this to the Grafana view.
There is one more question: also in your blog you write briefly on some metrics what they can imply / tell. I tried to find further information like this specially for the wiredTiger metrics but did not found something useful. Do you know a source which you can share?
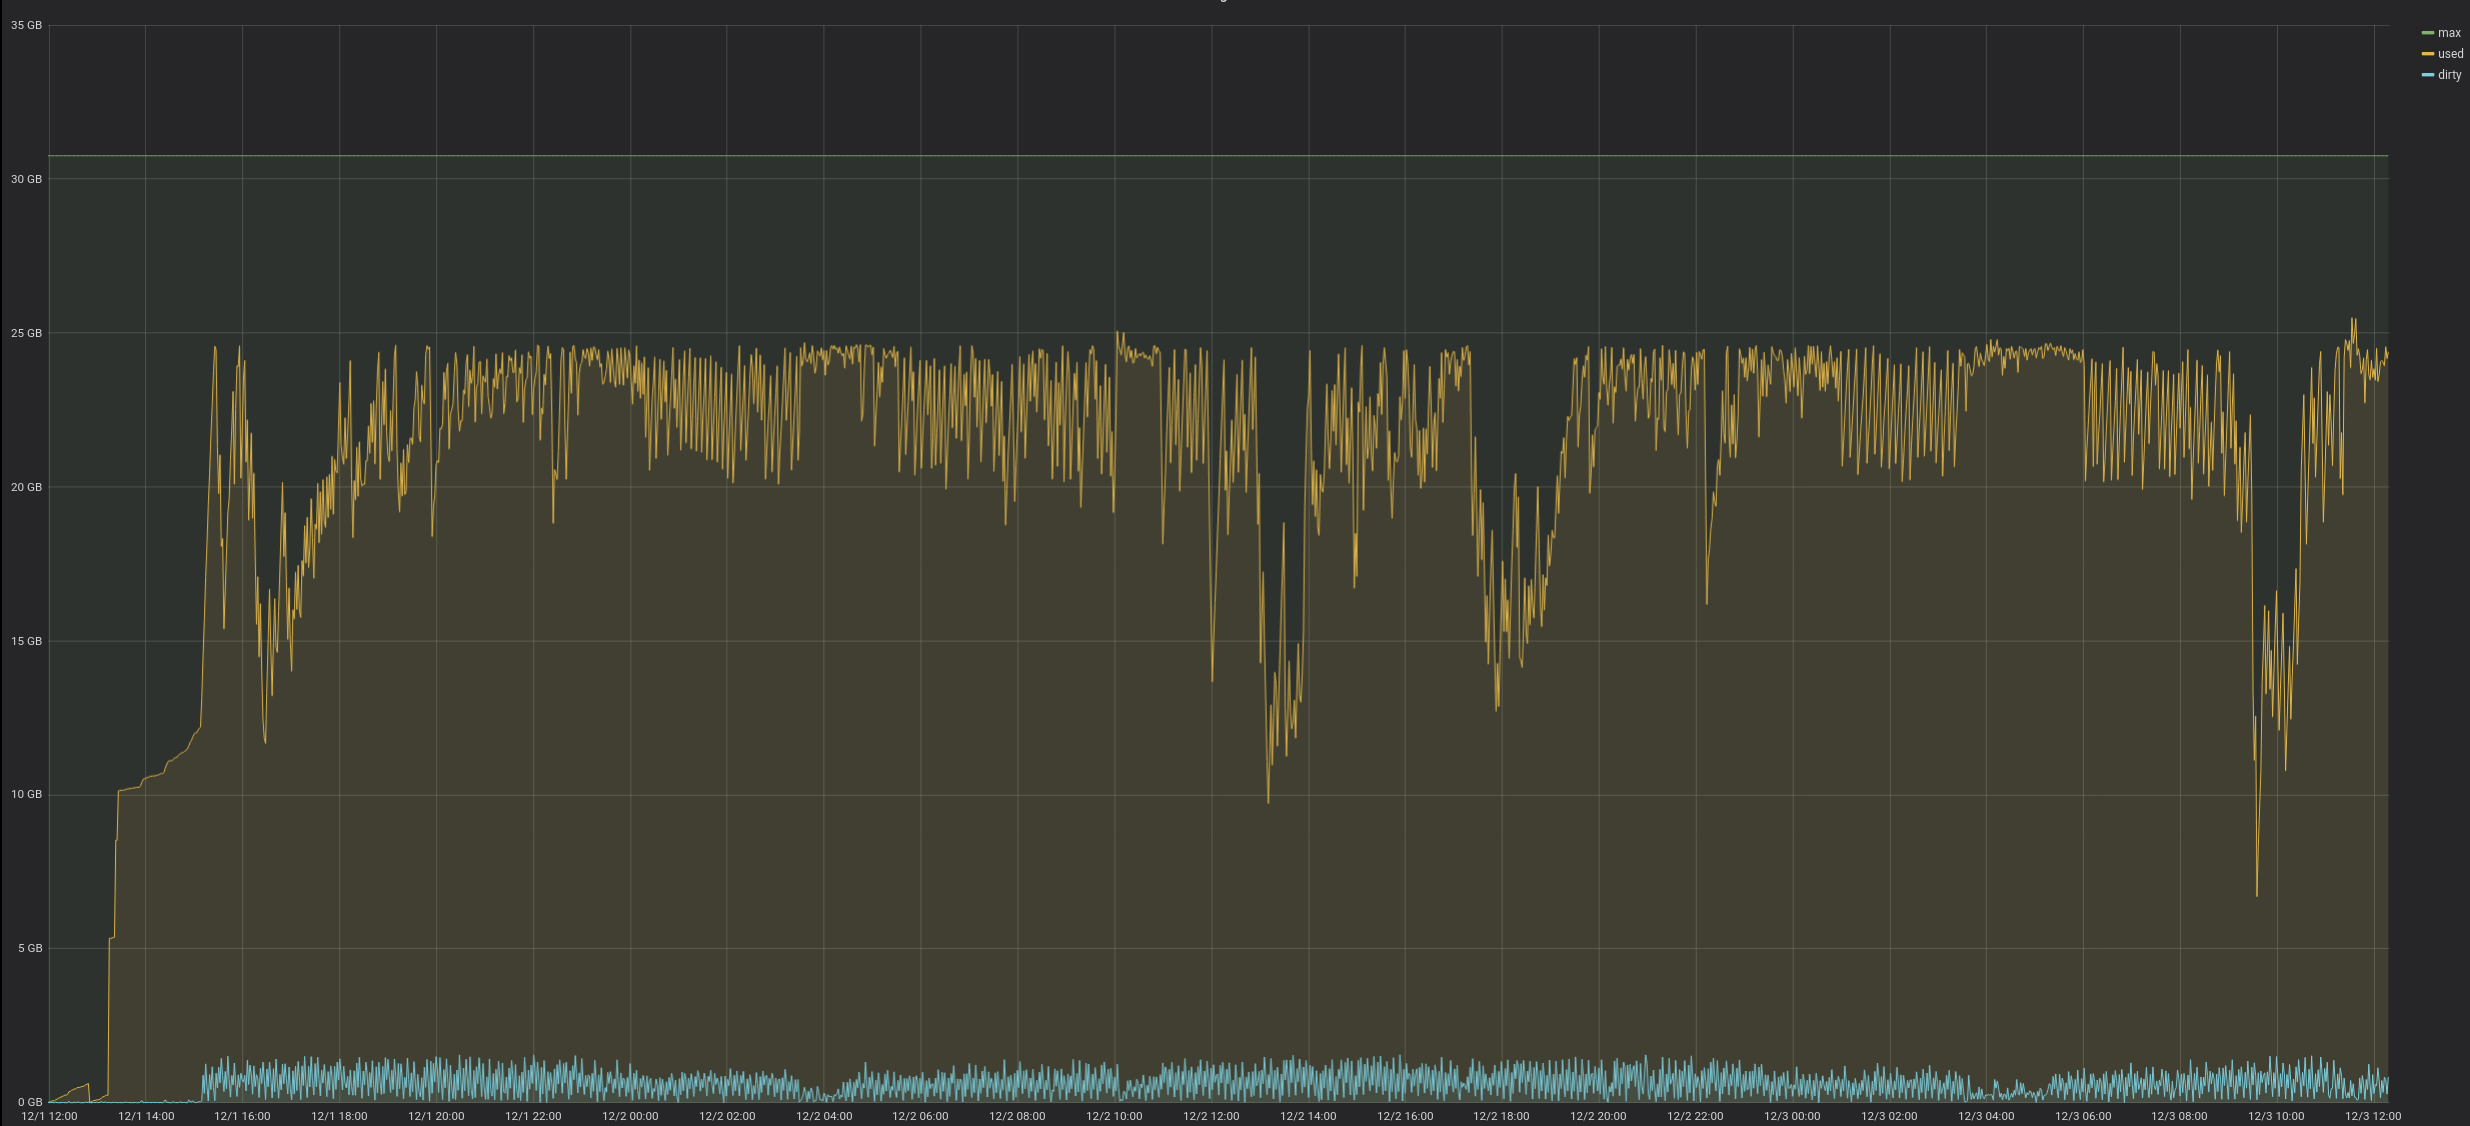
In practice: here is a system which starts after a while to have a constant amount of dirty cache. I would like to understand why.
@michael_hoeller, there is much information and knowledge I can’t answer in a simple reply. Read the Part 1 of my blogs for the logs analytics. This is where I usually begin with when I work with a customer. Read the Part 3 which explains the reasons metrics are flagged if any. Check out MongoDB University for additional info.
From the info you sent me via DM, you had a typical case of bad schema design. A performance degrade experience can be from many factors. Memory is one of them, but mongod will always try to use as much memory as it can get. After all memory is used, the system begins the process of paging in/out, and thus, in this case, disk quality also counts. Check out MongoDB Consulting if you need professional helps.
thanks for you reply. I am all aware of this. The initial question was how to find out which sizes does my working set for recent processed documents needs. If I give a mongod 64 GB it will use it also 128 GB and so on. The initial question could be rephrased as: how to measure the minimal size needed for recent documents in cache, So this is not like in the design phase where we estimate document sizes, connections and try to get a feeling, this is about to measure in a running system. Unfortunately this answer is not mentioned in any of the links. Did I missed this part or do we just have not such a metric?