High value of timeWaitingMicros.cache

Hi,

I see a high value of the timeWaitingMicros.cache metric in log messages during periods of high load.

For example:

{"t":{"$date":"2021-01-26T12:21:07.922+03:00"},"s":"I", "c":"COMMAND", "id":51803, "ctx":"conn410437","msg":"Slow query","attr":{"type":"command","ns":"zzzzz.$cmd","command":{"update":"xxxx.yyyy",... "storage":{"data":{"bytesRead":20458,"bytesWritten":2135043,"timeReadingMicros":270,"timeWritingMicros":12256},"timeWaitingMicros":{"cache":626588}},"protocol":"op_msg","durationMillis":698}}

What could be the reason for the high value of the timeWaitingMicros.cache metric?

Hi @Konstantin,

What’s the state of your hardware during these “high load”? CPU / RAM / IOPS ?
Is one of them saturated?

Just based on the definition of this metric, I would suppose that your RAM is full and eventually swapping or can’t evict fast enough?

Also this looks like a “slow query” - is it using an index correctly? Did you look at the explain plan?

Cheers,
Maxime.

Hi @MaBeuLux88,

I don’t observe saturation for CPU, RAM, IOPS.
Swapping disabled.

The developers claim they don’t use such queries .

The full log message:

{"t":{"$date":"2021-01-26T12:21:07.922+03:00"},"s":"I", "c":"COMMAND", "id":51803, "ctx":"conn410437","msg":"Slow query","attr":{"type":"command","ns":"zzz.$cmd","command":{"update":"xxx.yyy","ordered":false,"lsid":{"id":{"$uuid":"2fbe313b-2d87-4f18-8a1b-36321d373c32"}},"txnNumber":156218,"$clusterTime":{"clusterTime":{"$timestamp":{"t":1611652867,"i":1835}},"signature":{"hash":{"$binary":{"base64":"AAAAAAAAAAAAAAAAAAAAAAAAAAA=","subType":"0"}},"keyId":0}},"$db":"irkkt"},"numYields":15,"reslen":245,"locks":{"ParallelBatchWriterMode":{"acquireCount":{"r":115}},"ReplicationStateTransition":{"acquireCount":{"w":116}},"Global":{"acquireCount":{"w":115}},"Database":{"acquireCount":{"w":115}},"Collection":{"acquireCount":{"w":115}},"Mutex":{"acquireCount":{"r":100}}},"flowControl":{"acquireCount":65,"timeAcquiringMicros":65},"storage":{"data":{"bytesRead":20458,"bytesWritten":2135043,"timeReadingMicros":270,"timeWritingMicros":12256},"timeWaitingMicros":{"cache":626588}},"protocol":"op_msg","durationMillis":698}}

In Studio 3T, I see a collection scan, but I’m not sure if I looked right.

Best regards,
Konstantin

Looks like about 2MB of data was written in 698ms during this update operation. Could start to be a lot for your disks if you have many concurrent write operations at that time. But that depends a lot on your hardware here.

You need to identify which update operation exactly is triggering this and run a db.yourCollection.explain("executionStats").update(<your actual operation>) on it to see what is happening exactly. Double check that you are using an index for the query part of the operation, etc.

Putting the explain right after the collection name will “fake” the operation and not affect your documents. Putting it after the update operation will actually do it.

Please provide the explain plan for this operation so I can help more.

I can’t find the update operation. There is no operation in the log message.

How can I find the update operation?

Best regards,
Konstantin

I thought you redacted the output like "update":"xxx.yyy" and remove the part that contains the actual query.

Else what you could do is activate the profiler at level 1 with slowms at 600. This will store all the slow operations (>600ms) in the system.profile collection. Keep that running for some time. Especially during a busy moment for your cluster would be great. But then don’t forget to turn it off when you are done.

You can then analyse the content of this collection to find the worst queries to focus on first, identify missing indexes, etc.

If you are running on MongoDB Atlas, this is fully automated, it’s called the Performance Advisor. It will recommend indexes automatically.

Hi @MaBeuLux88,

I turned on the profiler and ran explain db.HLQ.state.explain("executionStats").update(...).

  • Query
{ "op" : "update", "ns" : "dbname.HLQ.state", "command" : { "q" : { "hlq.sign" : "33333421035679142344444" }, "u" : { "$set" : { "hlq" : { "sign" : "33333421035679142344444", "sign_type" : 0, ... }, "multi" : false, "upsert" : false }, "keysExamined" : 1, "docsExamined" : 1, "nMatched" : 1, "nModified" : 1, "keysInserted" : 7, "keysDeleted" : 7, "numYield" : 1, "queryHash" : "7DA4FEF0", "planCacheKey" : "538C9C8D", "locks" : { "ParallelBatchWriterMode" : { "acquireCount" : { "r" : NumberLong(3) } }, "ReplicationStateTransition" : { "acquireCount" : { "w" : NumberLong(4) } }, "Global" : { "acquireCount" : { "r" : NumberLong(1), "w" : NumberLong(3) } }, "Database" : { "acquireCount" : { "w" : NumberLong(3) } }, "Collection" : { "acquireCount" : { "w" : NumberLong(3) } }, "Mutex" : { "acquireCount" : { "r" : NumberLong(2) } } }, "flowControl" : { "acquireCount" : NumberLong(17), "timeAcquiringMicros" : NumberLong(21) }, "storage" : { "data" : { "bytesRead" : NumberLong(489844), "bytesWritten" : NumberLong(672696), "timeReadingMicros" : NumberLong(15626), "timeWritingMicros" : NumberLong(13037) }, "timeWaitingMicros" : { "cache" : NumberLong(915655) } }, "millis" : 1402, "planSummary" : "IXSCAN { hlq.sign: 1 }", "execStats" : { "stage" : "UPDATE", "nReturned" : 0, "executionTimeMillisEstimate" : 70, "works" : 2, "advanced" : 0, "needTime" : 1, "needYield" : 0, "saveState" : 1, "restoreState" : 1, "isEOF" : 1, "nMatched" : 1, "nWouldModify" : 1, "wouldInsert" : false, "inputStage" : { "stage" : "FETCH", "nReturned" : 1, "executionTimeMillisEstimate" : 11, "works" : 1, "advanced" : 1, "needTime" : 0, "needYield" : 0, "saveState" : 2, "restoreState" : 2, "isEOF" : 0, "docsExamined" : 1, "alreadyHasObj" : 0, "inputStage" : { "stage" : "IXSCAN", "nReturned" : 1, "executionTimeMillisEstimate" : 11, "works" : 1, "advanced" : 1, "needTime" : 0, "needYield" : 0, "saveState" : 2, "restoreState" : 2, "isEOF" : 0, "keyPattern" : { "hlq.sign" : 1 }, "indexName" : "hlq.sign_1", "isMultiKey" : false, "multiKeyPaths" : { "hlq.sign" : [ ] }, "isUnique" : false, "isSparse" : false, "isPartial" : false, "indexVersion" : 2, "direction" : "forward", "indexBounds" : { "hlq.sign" : [ "[\"33333421035679142344444\", \"33333421035679142344444\"]" ] }, "keysExamined" : 1, "seeks" : 1, "dupsTested" : 0, "dupsDropped" : 0 } } }, "ts" : ISODate("2021-02-01T11:29:51.591Z"), "client" : "10.0.0.146", "allUsers" : [ ], "user" : "" }
  • Explain
{

        "queryPlanner" : {

                "plannerVersion" : 1,

                "namespace" : "dbname.HLQ.state",

                "indexFilterSet" : false,

                "parsedQuery" : {

                        "hlq.sign" : {

                                "$eq" : "33333421035679142344444"

                        }

                },

                "winningPlan" : {

                        "stage" : "UPDATE",

                        "inputStage" : {

                                "stage" : "FETCH",

                                "inputStage" : {

                                        "stage" : "IXSCAN",

                                        "keyPattern" : {

                                                "hlq.sign" : 1

                                        },

                                        "indexName" : "hlq.sign_1",

                                        "isMultiKey" : false,

                                        "multiKeyPaths" : {

                                                "hlq.sign" : [ ]

                                        },

                                        "isUnique" : false,

                                        "isSparse" : false,

                                        "isPartial" : false,

                                        "indexVersion" : 2,

                                        "direction" : "forward",

                                        "indexBounds" : {

                                                "hlq.sign" : [

                                                        "[\"33333421035679142344444\", \"33333421035679142344444\"]"

                                                ]

                                        }

                                }

                        }

                },

                "rejectedPlans" : [ ]

        },

        "executionStats" : {

                "executionSuccess" : true,

                "nReturned" : 0,

                "executionTimeMillis" : 55,

                "totalKeysExamined" : 1,

                "totalDocsExamined" : 1,

                "executionStages" : {

                        "stage" : "UPDATE",

                        "nReturned" : 0,

                        "executionTimeMillisEstimate" : 1,

                        "works" : 2,

                        "advanced" : 0,

                        "needTime" : 1,

                        "needYield" : 0,

                        "saveState" : 0,

                        "restoreState" : 0,

                        "isEOF" : 1,

                        "nMatched" : 1,

                        "nWouldModify" : 1,

                        "wouldInsert" : false,

                        "inputStage" : {

                                "stage" : "FETCH",

                                "nReturned" : 1,

                                "executionTimeMillisEstimate" : 1,

                                "works" : 1,

                                "advanced" : 1,

                                "needTime" : 0,

                                "needYield" : 0,

                                "saveState" : 1,

                                "restoreState" : 1,

                                "isEOF" : 0,

                                "docsExamined" : 1,

                                "alreadyHasObj" : 0,

                                "inputStage" : {

                                        "stage" : "IXSCAN",

                                        "nReturned" : 1,

                                        "executionTimeMillisEstimate" : 1,

                                        "works" : 1,

                                        "advanced" : 1,

                                        "needTime" : 0,

                                        "needYield" : 0,

                                        "saveState" : 1,

                                        "restoreState" : 1,

                                        "isEOF" : 0,

                                        "keyPattern" : {

                                                "hlq.sign" : 1

                                        },

                                        "indexName" : "hlq.sign_1",

                                        "isMultiKey" : false,

                                        "multiKeyPaths" : {

                                                "hlq.sign" : [ ]

                                        },

                                        "isUnique" : false,

                                        "isSparse" : false,

                                        "isPartial" : false,

                                        "indexVersion" : 2,

                                        "direction" : "forward",

                                        "indexBounds" : {

                                                "hlq.sign" : [

                                                        "[\"33333421035679142344444\", \"33333421035679142344444\"]"

                                                ]

                                        },

                                        "keysExamined" : 1,

                                        "seeks" : 1,

                                        "dupsTested" : 0,

                                        "dupsDropped" : 0

                                }

                        }

                }

        },

        "serverInfo" : {

                "host" : "mongo01",

                "port" : 27017,

                "version" : "4.4.2",

                "gitVersion" : "15e73dc5738d2278b688f8929aee605fe4279b0e"

        },

        "ok" : 1,

        "$clusterTime" : {

                "clusterTime" : Timestamp(1612202001, 2215),

                "signature" : {

                        "hash" : BinData(0,"AAAAAAAAAAAAAAAAAAAAAAAAAAA="),

                        "keyId" : NumberLong(0)

                }

        },

        "operationTime" : Timestamp(1612202001, 2121)

}

The request completed quickly. He has a good access plan.

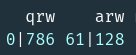
We have a queue of write queries:

mongostat
insert query update delete getmore command dirty  used flushes vsize  res   qrw    arw net_in net_out  conn        set repl                time
   112 10089   2353      5     383  2303|0 20.8% 85.1%       0  283G 197G 0|786 61|128  7.41m   78.7m 16276 xxxxxx PRI Feb  1 16:00:04.057

Top queries:

{ "op" : "insert", "command" : {  }, "millis" : 133940, "client" : "10.0.0.77" }
{ "op" : "insert", "command" : {  }, "millis" : 96181, "client" : "10.0.0.76" }
{ "op" : "insert", "command" : {  }, "millis" : 73975, "client" : "10.0.0.76" }
{ "op" : "insert", "command" : {  }, "millis" : 62515, "client" : "10.0.0.77" }
{ "op" : "insert", "command" : {  }, "millis" : 61380, "client" : "10.0.0.76" }
{ "op" : "insert", "command" : {  }, "millis" : 55350, "client" : "10.0.0.77" }
{ "op" : "insert", "command" : {  }, "millis" : 52383, "client" : "10.0.0.77" }
{ "op" : "insert", "command" : {  }, "millis" : 48277, "client" : "10.0.0.78" }
{ "op" : "insert", "command" : {  }, "millis" : 47941, "client" : "10.0.0.76" }
{ "op" : "insert", "command" : {  }, "millis" : 47846, "client" : "10.0.0.76" }
{ "op" : "insert", "command" : {  }, "millis" : 47621, "client" : "10.0.0.77" }
{ "op" : "insert", "command" : {  }, "millis" : 45234, "client" : "10.0.0.76" }
{ "op" : "insert", "command" : {  }, "millis" : 43663, "client" : "10.0.0.78" }
{ "op" : "insert", "command" : {  }, "millis" : 39867, "client" : "10.0.0.78" }
{ "op" : "insert", "command" : {  }, "millis" : 39616, "client" : "10.0.0.78" }
{ "op" : "insert", "command" : {  }, "millis" : 36962, "client" : "10.0.0.77" }
{ "op" : "insert", "command" : {  }, "millis" : 36874, "client" : "10.0.0.77" }
{ "op" : "insert", "command" : {  }, "millis" : 23735, "client" : "10.0.0.76" }
{ "op" : "update", "command" : {  }, "millis" : 1784, "client" : "10.0.0.152" }
{ "op" : "update", "command" : {  }, "millis" : 1739, "client" : "10.0.0.126" }
{ "op" : "update", "command" : {  }, "millis" : 1714, "client" : "10.0.0.77" }
{ "op" : "update", "command" : {  }, "millis" : 1687, "client" : "10.0.0.125" }
{ "op" : "insert", "command" : {  }, "millis" : 1659, "client" : "10.0.0.127" }
{ "op" : "update", "command" : {  }, "millis" : 1637, "client" : "10.0.0.116" }
{ "op" : "update", "command" : {  }, "millis" : 1623, "client" : "10.0.0.78" }
{ "op" : "update", "command" : {  }, "millis" : 1614, "client" : "10.0.0.151" }
{ "op" : "update", "command" : {  }, "millis" : 1611, "client" : "10.0.0.150" }
{ "op" : "update", "command" : {  }, "millis" : 1556, "client" : "10.0.0.76" }
{ "op" : "insert", "command" : {  }, "millis" : 1527, "client" : "10.0.0.146" }
{ "op" : "update", "command" : {  }, "millis" : 1523, "client" : "10.0.0.114" }
{ "op" : "update", "command" : {  }, "millis" : 1508, "client" : "10.0.0.144" }
{ "op" : "update", "command" : {  }, "millis" : 1500, "client" : "10.0.0.125" }
{ "op" : "update", "command" : {  }, "millis" : 1472, "client" : "10.0.0.109" }

many updates

We also have a lot of global locks and no write tickets available.
Can insert prevent update, or vice versa?

Best regards,
Konstantin

Hey @Konstantin,

I have a few questions:

  • What version of MongoDB are you running?
  • Are you using multi-docs transactions for these commands?
  • Are you sharded or it’s just a replica set?
  • What’s the config of your cluster? P-S-S?
  • How much data do you have in our node? (total storage size of the databases)
  • What’s the total size of your indexes?
  • How much RAM do you have per node?
  • How many indexes do you have on this collection where the inserts are slow? Too many indexes can slow down insert operations as all the indexes have to be updated accordingly.

Thanks,
Maxime.

Hey again @Konstantin,

From what I see from your mongostats, you are queuing a lot.

image

You have 786 write operation queuing and 128 currently happening. I think your disk is saturating. Too many write operations probably and your disk can’t keep up with the load.

If you have many indexes maybe you could offload the indexes to another SSD by using the wiredTigerDirectoryForIndexes option. You could also offload the logs.

Cheers,
Maxime.