Hi Team, this post will hopefully save someone time if they encounter the same issue I did.
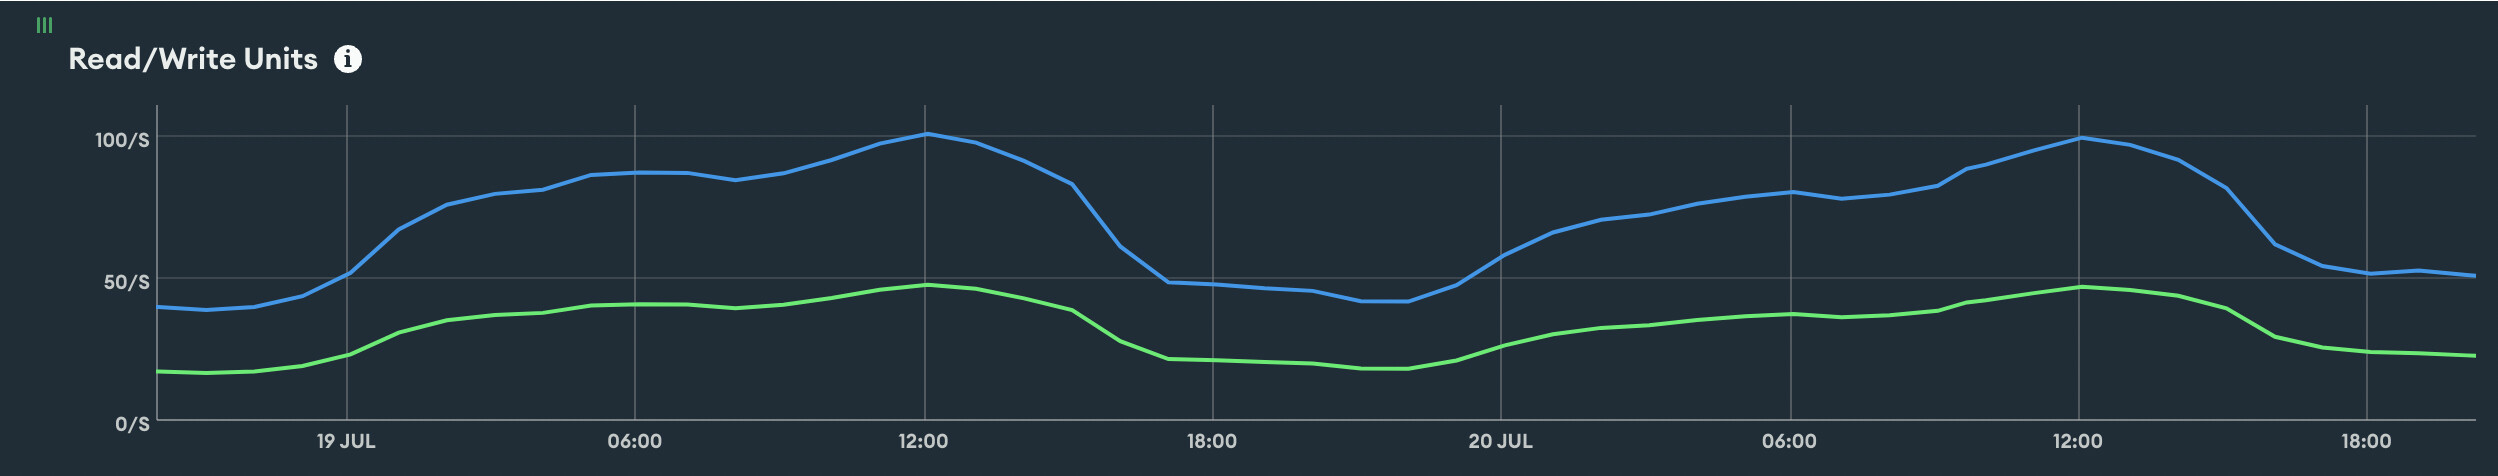
I recently moved my app onto a Serverless cluster and started seeing high RPU / WPU stats under the monitoring of the cluster in Atlas.
This was strange because no one was using my app. I contacted support who confirmed that this was unexpected for a cluster that wasn’t meant to be doing any work. Even disconnecting my app completely from Atlas and blocking all network traffic didn’t resolve the issue. Only dropping the DB, or more specifically, the TTL index on one of my collections, stopped the high RPU/WPU usage.
It turns out the culprit appears to be the way my Schema is configured in Mongoose…
Bad:
createdAt: {type: Date, default: Date.now, expires: 86400}
Good:
createdAt: {type: Date, default: Date, expires: 86400}
After chaning Date.now to Date, my WPU is basically zero per second when the app isn’t doing anything, while RPU is sitting at about 8/s.
Using Date.now somehow causes Atlas to do some kind of endless loop???
Using Date seems to work just fine.
It would be interesting if someone can explain why this is a problem in Atlas Serverless.
I only picked it up because I noticed my billing was much higher than expected so I’m not sure if this is also a problem in my dev environment, but I simply never noticed.
Cheers, Daniel.