while monitoring server observed high memory and cpu utilization.i am not able sort the issue can anybody help with this. hardware config is 32gb(RAM) and 630gb(storage)
We are going to need more information to be able to start and help.
What is considered “high memory”?
What is the OS and Version?
What is the MongoDB Version?
What is the MongoDB Deployment Architecture? For example replica, sharded, standalone. How many MongoDB processes are running on a server
memory utilization by mongo is crossing 50%
os= ubuntu 20.04
mongodb version=5.0
standalone server
single mongo process
In my experience, execution of sort depends on data size to be sorted, indexes, and query design too. Index Details and Query would help to answer your questions in better way.
Use of proper indexing can make this task easy.
This is pretty expected, with the WireTiger Cache taking 50% memory by default.
Memory Use
With WiredTiger, MongoDB utilizes both the WiredTiger internal cache and the filesystem cache.
Starting in MongoDB 3.4, the default WiredTiger internal cache size is the larger of either:
- 50% of (RAM - 1 GB), or
- 256 MB.
For example, on a system with a total of 4GB of RAM the WiredTiger cache will use 1.5GB of RAM (0.5 * (4 GB - 1 GB) = 1.5 GB). Conversely, a system with a total of 1.25 GB of RAM will allocate 256 MB to the WiredTiger cache because that is more than half of the total RAM minus one gigabyte (0.5 * (1.25 GB - 1 GB) = 128 MB < 256 MB).
solution for that? , what action should be taken to minimize the memory utilization
If you are not running high cost aggregate operation, then sometimes its due to wiredTiger cache.
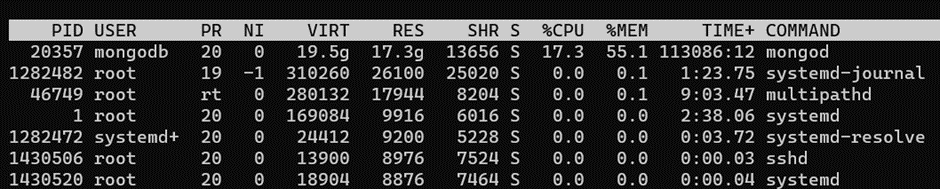
To start with, can you post output of below commands:
top
Press SHIFT + m to sort the output by memory utilization.
Post the output of first few lines.
free -m
On Mongo Shell:
db.serverStatus().mem

var mem = db.serverStatus().tcmalloc;

mem.tcmalloc.formattedString
Please post the output from the above commands to investigate further.
For that, few more information required:
- Query ?
- collection’s statistics using following commands. Replace coll with your collectionname
db.coll.getIndexes()
db.coll.stats().indexSizes
db.coll.stats().storageSize
db.coll.stats().count
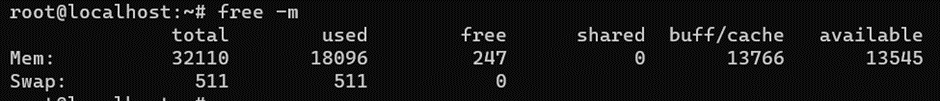
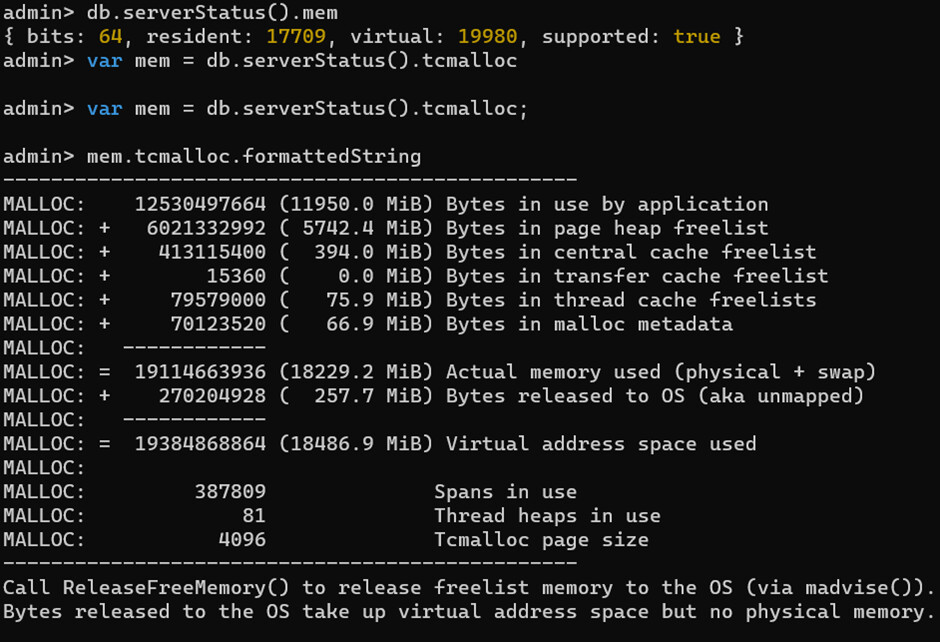
Summary of the output:
Total memory used by Mongo DB is 18229.2 MiB ≈ 18GB (55% of Total RAM), out of which 5.6 GB (30% of the MongoDB consumed memory) is in the free list (part of memory which is currently empty but held by MongoDB so that it can be immediately assigned to store data whenever required for upcoming requests).
In other words, Free list is a way of enhancing performance by keeping some memory in hand so that it can be quickly assigned to new requests, instead of requesting OS each time. This enhances the overall execution by saving time and compute for allocation and deallocation of memory pages.
So basically your MongoDB is actually consuming 11950 MB ≈ 11.6 GB ≈ 37% of your total RAM
Let me give a brief on MongoDB memory management. By Default, the MongoDB uses Google tcmalloc as its memory allocator. The majority of memory gets allocated to wiredTiger (Default Storage Engine from MongoDB 3.2) for data processing. Now, to control the upper limit of the memory that should be used by the WiredTiger engine, MongoDB uses a parameter cacheSizeGB which is set to about 60% of the system’s usable memory by default. This is to prevent situations like system crash due MongoDB running out of Full System Memory to satisfy a given workload.
You can check your current ‘cacheSizeGB’ settings through the below command:
My Test Env. with 32GB RAM
db.serverStatus().wiredTiger.cache

'bytes currently in the cache': Long("13028203994"),
'maximum bytes configured': Long("16299065344"), <<-- cacheSizeGB
So once the memory consumption reaches to a threshold (80% to 90% of cacheSizeGB ), wiredTiger begins to start eliminations of CLEAN and DIRTY PAGES. Cutting long story short, it is normal to have upto 60% of RAM consumed by Mongod process, if the MongoDB is the only Application running on the server.
For the deployments with heavy workloads, you need to monitor
'bytes currently in the cache': Long("13028203994"),
'maximum bytes configured': Long("16299065344"), <<-- cacheSizeGB
There is no major problem if MongoDB cache utilization is generally “0.8 * cacheSizeGB” and under or if it occasionally exceeds. BUT IF the increase persists for a considerable amount of time, then that means the memory elimination pressure is high, and you should really consider looking for top resource consuming user connections / queries to tune or increase memory or consider having faster SSDs to enhance SWAP IO throughput.
4 Likes