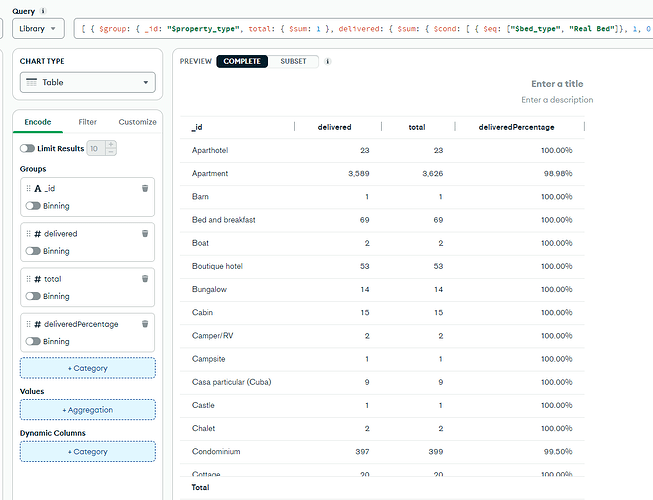
We have a collection of ‘messages’ documents. I’d like to use Charts to present my customers with a visualisation of the number of messages that were delivered. I’ve used answers in this forum to put together the aggregation pipeline shown below, which gives me the percentage delivered for ALL customers. I would like to be able to use an injected function to filter the documents by the existing customerid field, so that each customer can see just their own delivered percentage. How can I do that?
[
  {
    $facet: {
      delivered: [
        {
          $match: {
            status: "DELIVERED"
          }
        },
        {
          $count: "count"
        }
      ],
      total: [{ $count: "count" }]
    }
  },
  {
    $unwind: "$delivered"
  },
  {
    $unwind: "$total"
  },
  {
    $set: {
      deliveredPercentage: {
        $divide: ["$delivered.count", "$total.count"]
      }
    }
  }
]
