db.printSlaveReplicationInfo() command response very Slow

Hi All ,

I’m facing performance issue cause of db.printSlaveReplicationInfo() command in very old version of mongodb . Can anyone please suggest if there is any known issue for similar case.

MongoDB Version : 3.2.1 - We know, this is a very old version and on it to upgrade

namespace                                      operation    pattern    count    min (ms)    max (ms)    95%-ile (ms)    sum (ms)    mean (ms)    allowDiskUse

local.system.replset                           count        {}           227         101     2052311          8187.7     4786039      21083.9    None
local.oplog.rs                                 query        None          77         107        3346          2682.8      105609       1371.5    None
local.system.replset                           query        None          44         195       16021          2829.9       74833       1700.8    None

Strace logs :
strace -i -t -f mongo --quiet --eval “db.printSlaveReplicationInfo()” as per logs it took around 10 mins to print the response,

execve("/usr/bin/mongo", ["mongo", "--quiet", "--eval", "db.printSlaveReplicationInfo()"], [/* 23 vars */]) = 0

[pid 15343] 01:52:22 [00000033b9e0ed5c] sendto(3, "Y\0\0\0\2\0\0\0\0\0\0\0\332\7\0\0local\0count\0008\0\0\0"..., 89, MSG_NOSIGNAL, NULL, 0) = 89
[pid 15343] 01:52:22 [00000033b9e0ebdc] recvfrom(3,

"?\0\0\0N\23;\10\2\0\0\0\333\7\0\0", 16, MSG_NOSIGNAL, NULL, NULL) = 16
[pid 15343] 02:04:21 [00000033b9e0ebdc] recvfrom(3, "*\0\0\0\22waitedMS\0\0\0\0\0\0\0\0\0\20n\0\1\0\0\0\1ok"..., 47, MSG_NOSIGNAL, NULL, NULL) = 47
[pid 15343] 02:04:21 [00000033b9e0ed5c] sendto(3, "K\0\0\0\3\0\0\0\0\0\0\0\332\7\0\0admin\0replSetGet"..., 75, MSG_NOSIGNAL, NULL, 0) = 75
[pid 15343] 02:04:21 [00000033b9e0ebdc] recvfrom(3, "(\4\0\0R\23;\10\3\0\0\0\333\7\0\0", 16, MSG_NOSIGNAL, NULL, NULL) = 16
[pid 15343] 02:04:21 [00000033b9e0ebdc] recvfrom(3, "\23\4\0\0\2set\0\n\0\0\0vinay1\0\tdate\0006\304\216"..., 1048, MSG_NOSIGNAL, NULL, NULL) = 1048
[pid 15343] 02:04:21 [00000033b9adae84] fstat(1, {st_mode=S_IFCHR|0620, st_rdev=makedev(136, 0), ...}) = 0
[pid 15343] 02:04:21 [00000033b9ae531a] mmap(NULL, 4096, PROT_READ|PROT_WRITE, MAP_PRIVATE|MAP_ANONYMOUS, -1, 0) = 0x7fa3a18ee000
[pid 15343] 02:04:21 [00000033b9adb57d] write(1, "source: abcc.o"..., 41source: abcc.org:27017
) = 41
[pid 15343] 02:04:21 [00000033b9adae35] stat("/etc/localtime", {st_mode=S_IFREG|0644, st_size=2294, ...}) = 0
[pid 15343] 02:04:21 [00000033b9adb57d] write(1, "\tsyncedTo: Tue Mar 08 2022 01:20"..., 51	syncedTo: Tue Mar 08 2022 01:20:34 GMT-0600 (CST)
) = 51
[pid 15343] 02:04:21 [00000033b9adb57d] write(1, "\t2626 secs (0.73 hrs) behind the"..., 42	2626 secs (0.73 hrs) behind the primary
) = 42
[pid 15343] 02:04:21 [00000033b9adb57d] write(1, "source: abc.o"..., 41source: abc.org:27017
) = 41
[pid 15343] 02:04:21 [00000033b9adae35] stat("/etc/localtime", {st_mode=S_IFREG|0644, st_size=2294, ...}) = 0
[pid 15343] 02:04:21 [00000033b9adb57d] write(1, "\tsyncedTo: Mon Mar 07 2022 20:02"..., 51	syncedTo: Mon Mar 07 2022 20:02:11 GMT-0600 (CST)
) = 51
[pid 15343] 02:04:21 [00000033b9adb57d] write(1, "\t21729 secs (6.04 hrs) behind th"..., 43	21729 secs (6.04 hrs) behind the primary
) = 43
Looks like everything is completely overloaded and the secondaries can’t keep up with the primary.
This is honestly VERY concerning.

Reduce the workload or increase the server capacities ASAP. RAM + CPU + IOPS.
The fact that the primary can’t keep up means that it cannot acknowledge write operation with writeConcern w>1 and this also means that their is an additional cache pressure on the primary which can’t move the majority-commit point forward.

I would first stabilize this system before considering upgrading anything. You need a health cluster to consider doing a rolling upgrade a new version.

In this current state, if the primary goes down, one secondary will be elected (I guess) and it’s going to rollback 0.73hrs worth of data. (The most up-to-date node should win the election).

Find out first which ressources is saturated on the secondaries and work on them one by one until they can catch up with the primary. Once you are confident than one of them can be elected primary, you can work on the primary. If you are using the default readPreference and writeConcern, the primary should be doing the reads and the writes while the secondary should only be doing the writes. So in theory they should be less overloaded than the primary.

Cheers,
Maxime.

Thanks Max for the response and sharing detailed info.

My queries are listed below :

  1. if we use this command (db.printSlaveReplicationInfo() ) over mongoshell then does mongo server use any kind of locking on oplog collection to calculate the replication lag ?. why this command is so expensive than other admins commands ?

  2. if secondary is pulling oplog from the synchronisation source then how do we check the status whether it’s pulling or stuck by responsible thread or producer thread ?

  3. is there any way to trace replwriter thread activity in details whether does it apply oplog to itself or not ?

  4. As per repl metrics , replops counter was not getting incremented so do we use any logic to apply the oplog based on any logic like scheduler frequency or buffer full , Could you plz share more insight on this ?

DB server status for repl metrics .

   "repl" : {
   		"executor" : {
   			"counters" : {
   				"eventCreated" : 2,
   				"eventWait" : 2,
   				"cancels" : 55145773,
   				"waits" : 129239302,
   				"scheduledNetCmd" : 334840,
   				"scheduledDBWork" : 0,
   				"scheduledXclWork" : 0,
   				"scheduledWorkAt" : 55522254,
   				"scheduledWork" : 129239360,
   				"schedulingFailures" : 0
   			},
   			"queues" : {
   				"networkInProgress" : 0,
   				"dbWorkInProgress" : 0,
   				"exclusiveInProgress" : 0,
   				"sleepers" : 4,
   				"ready" : 0,
   				"free" : 17
   			},
   			"unsignaledEvents" : 4,
   			"eventWaiters" : 0,
   			"shuttingDown" : false,
   			"networkInterface" : "NetworkInterfaceASIO inShutdown: 0"
   		},
   		"apply" : {
   			"batches" : {
   				"num" : 11559352,
   				"totalMillis" : 6564
   			},
   			"ops" : NumberLong(243908927)
   		},
   		"buffer" : {
   			"count" : NumberLong(1383730),
   			"maxSizeBytes" : 268435456,
   			"sizeBytes" : NumberLong(266197984)
   		},
   		"network" : {
   			"bytes" : NumberLong("46889211548"),
   			"getmores" : {
   				"num" : 54978354,
   				"totalMillis" : 160607439
   			},

Reduce the workload or increase the server capacities ASAP. RAM + CPU + IOPS. – i don’t see capacity issue and as per metrics it was not overloaded. Do you see as per below , plz add

MongoDB server specs : RAM - 252 GB + vCPU’s - 32 + IOPS + 10TB pure storage disks in LVM so i don’t see capacity issues on Secondary node even we don’t use for read from Secondary.

Sar stats :

Mem: 
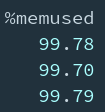
12:00:01 AM kbmemfree kbmemused  %memused kbbuffers  kbcached  kbcommit   %commit
01:50:01 AM    574332 263830316     99.78    287900  91780836 168020360     56.39
02:00:01 AM    783424 263621224     99.70    287952  91450596 168778552     56.64
02:10:01 AM    563308 263841340     99.79    287880  91232540 168892636     56.68

Device:
01:40:01 AM       DEV       tps  rd_sec/s  wr_sec/s  avgrq-sz  avgqu-sz     await     svctm     %util
01:50:01 AM    dev8-0      7.91      6.83    123.06     16.42      0.00      0.17      0.09      0.07
01:50:01 AM   dev8-16      0.00      0.00      0.00      0.00      0.00      0.00      0.00      0.00
01:50:01 AM   dev8-32      0.00      0.00      0.00      0.00      0.00      0.00      0.00      0.00
01:50:01 AM   dev8-48     43.53     21.01   5324.36    122.81      0.06      1.44      0.46      1.98
01:50:01 AM   dev8-64     48.59     22.86   5542.14    114.53      0.06      1.23      0.40      1.93
01:50:01 AM   dev8-80     47.32     21.88   5391.72    114.40      0.06      1.30      0.42      1.99
01:50:01 AM   dev8-96     48.64     22.62   5452.74    112.56      0.06      1.26      0.41      1.99
01:50:01 AM  dev253-0    188.08     88.37  21710.96    115.90      0.28      1.50      0.21      3.95
01:50:01 AM  dev253-1    191.84     88.37  21710.96    113.63      0.29      1.49      0.20      3.92
02:00:01 AM    dev8-0      8.77      0.84    148.13     16.98      0.00      0.17      0.08      0.07
02:00:01 AM   dev8-16      0.01      0.05      0.00      8.00      0.00      2.75      2.75      0.00
02:00:01 AM   dev8-32      0.00      0.03      0.00      8.00      0.00      0.00      0.00      0.00
02:00:01 AM   dev8-48      9.98      0.11    251.18     25.18      0.01      1.13      0.09      0.09
02:00:01 AM   dev8-64     10.70      0.10    271.60     25.38      0.01      1.04      0.08      0.09
02:00:01 AM   dev8-80     10.53      0.12    271.78     25.82      0.01      1.06      0.09      0.09
02:00:01 AM   dev8-96     10.66      0.13    274.87     25.79      0.01      1.05      0.08      0.09
02:00:01 AM  dev253-0     41.88      0.46   1069.42     25.55      0.05      1.13      0.03      0.11
02:00:01 AM  dev253-1     42.82      0.03   1069.42     24.98      0.05      1.11      0.02      0.10
02:10:01 AM    dev8-0      8.20      0.00    123.04     15.00      0.00      0.17      0.09      0.07
02:10:01 AM   dev8-16      0.00      0.00      0.00      0.00      0.00      0.00      0.00      0.00
02:10:01 AM   dev8-32      0.00      0.00      0.00      0.00      0.00      0.00      0.00      0.00
02:10:01 AM   dev8-48    106.64    143.96   7929.23     75.70      0.15      1.40      0.32      3.43
02:10:01 AM   dev8-64    128.48    147.57   8862.38     70.13      0.14      1.09      0.26      3.37
02:10:01 AM   dev8-80    124.11    142.89   8428.62     69.06      0.14      1.16      0.28      3.44
02:10:01 AM   dev8-96    128.53    144.05   8659.11     68.49      0.14      1.11      0.27      3.43
02:10:01 AM  dev253-0    487.75    578.47  33879.35     70.65      0.64      1.32      0.14      6.77
02:10:01 AM  dev253-1    492.88    578.47  33879.35     69.91      0.65      1.31      0.13      6.64
load: 
12:00:01 AM     CPU     %user     %nice   %system   %iowait    %steal     %idle
12:10:01 AM     all      6.42      0.00      0.22      0.12      0.00     93.24
12:20:01 AM     all      3.37      0.00      0.09      0.00      0.00     96.54
12:30:01 AM     all      6.61      0.00      0.23      0.09      0.00     93.06
12:40:01 AM     all      7.42      0.00      0.25      0.07      0.00     92.26
12:50:01 AM     all      3.42      0.00      0.14      0.00      0.00     96.44
01:00:01 AM     all      6.90      0.00      0.26      0.03      0.00     92.81
01:10:01 AM     all      3.32      0.00      0.09      0.00      0.00     96.59
01:20:01 AM     all      5.76      0.00      0.23      0.03      0.00     93.99
01:30:01 AM     all      4.77      0.00      0.14      0.01      0.00     95.08
01:40:01 AM     all      4.08      0.00      0.11      0.01      0.00     95.80
01:50:01 AM     all      8.22      0.00      0.27      0.05      0.00     91.46
02:00:01 AM     all      3.55      0.00      0.15      0.00      0.00     96.30
02:10:01 AM     all      9.80      0.00      0.40      0.13      0.00     89.68
02:20:02 AM     all      3.37      0.00      0.11      0.00      0.00     96.51

Hi @Vinay_Jaiswal ,

3.2.1 was released in Jan, 2016 so it is definitely time to upgrade. While you are planning your major version upgrades to a supported server release, I strongly recommend upgrading to 3.2.22 (the final 3.2 release) as it includes several years of bug fixes and stability improvements. Minor releases do not include any backward-breaking changes so will be compatible with your current driver versions.

Upgrading to 3.2.22 may not necessarily improve the performance issue you are seeing, but there are many other fixes. I also don’t think it is worth tracing into thread details in 3.2 as there will be no further changes for EOL server releases. It would make more sense to investigate this once you are on a supported release – I’d recommend MongoDB 4.2+, since 4.0 will be EOL in April.

Can you also confirm whether you are using the deprecated MMAP storage engine or WiredTiger (which became the default storage engine in 3.2)? There are significant differences in behaviour between storage engines.

Regards,
Stennie

Looks like your RAM is full also.

image