I am currently working on a data visualization task in MongoDB Atlas, where I need to create a line graph to track the total count of successful entries over a series of hours.
Here’s the challenge I’m facing: Each document in the data cluster has a numerical field, and for a document to be considered ‘successful,’ this field must fall within a specific range of values. I want to count only those documents that meet this criterion in order to generate the graph. Additionally, the count should be incremented at the corresponding timeframe specified by each document, resulting in a cumulative graph.
However, the complexity arises when I try to visualize cumulative data across multiple categories, which are also specified by the documents. Using a grouped column chart, I was able to create a cumulative graph, but it sums up the successful entries across all categories without distinguishing between them.
To overcome this, my goal is to create a cumulative line graph with multiple lines, where each line represents a different category. This way, I can analyze the cumulative success counts for each category separately.
I would greatly appreciate any guidance or suggestions on how to achieve this visualization in MongoDB Atlas. Thank you!
Hi @Matthew_Taylor -
Charts has a “Compare Value” option that you can use to calculate cumulative totals, but currently it only works on single series charts. If you want to make this work for multi-series charts you’ll need to write a custom aggregation pipeline.
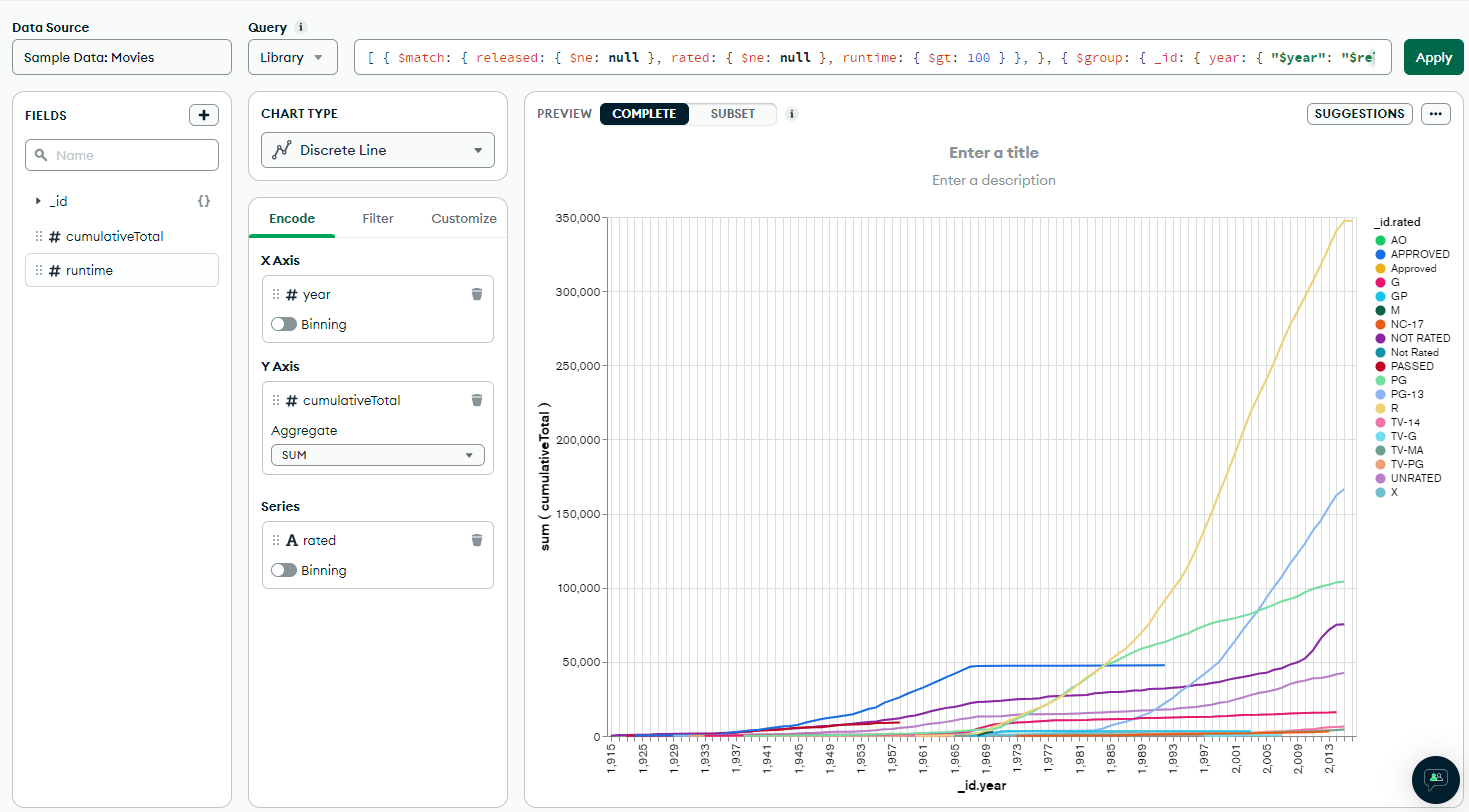
I’m not 100% sure I understand your requirements, but here’s an attempt to build a chart similar to what you are describing using the Movies sample dataset. Basically:
- The
$match stage filters out the documents that don’t match your criteria
- The
$group stage calculates the total for each period and category
- The
$setWindowFields stage calculates the cumulative total.
Query:
[
  {
    $match: {
      released: { $ne: null },
      rated: { $ne: null },
      runtime: { $gt: 100 }
    },
  },
  {
    $group: {
      _id: { year: { "$year": "$released" }, rated: "$rated" },
      runtime: { "$sum": "$runtime" }
    }
  },
  {
    $setWindowFields: {
      partitionBy: "$_id.rated",
      sortBy: { "_id.year": 1 },
      output: {
        cumulativeTotal: {
          $sum: "$runtime",
          window: { documents: ["unbounded", "current"] }
        }
      }
    }
  }
]
Resulting chart:
Does this help?
This helps. I was able to replicate that graph with the sample movies data. The main thing I am stumped on now is that my project handles the dates differently. Your code contains a $year field as well as a $released field, whereas my data has a $timestamp field with nothing else to compare it to in $group. The timestamp is also a date rather than a number. I am using your strategy but my X-axis just says “Invalid Date”.
Glad you’re making progress. In the sample I shared there is only a single date field called released. $year is an aggregation function which extracts the year part of a date. Charts does similar things in its pipelines but it gets a bit more complex if you need to extract multiple parts like $month as well. How do you want your dates displayed on the X axis?
Currently, our team requires timestamps to be as granular as possible, accommodating user-selected timeframes ranging from months to hours. However, this granularity is causing problems due to Charts’ 5000 document limit. We are in need of a workaround to overcome this limitation. Any suggestions or alternative approaches would be greatly appreciated.
There is also another issue we are encountering. When embedding the chart using the JavaScript SDK, we encounter an issue with the Y-axis not always starting at zero. We have tied using a filter in the Atlas Charts UI that allows us to choose the earliest date for the chart to display. However, because the data has already been accumulated since a certain date, the Y-axis doesn’t consistently begin at zero. As a temporary fix, we hardcoded a specific date in the aggregation pipeline to ensure the chart starts at zero. However, a new issue arises when users select a date via the JavaScript-based UI we implemented. If the selected date is after the hardcoded aggregation date, the chart starts above zero, which is undesirable. Currently, we are using the chart.setFilter() function in the JavaScript SDK.
I would like to know if there’s a reliable way to ensure the graph always starts at zero, or if it’s possible to modify the aggregation pipeline dynamically from the JavaScript SDK to address this issue.
Any guidance, suggestions, or code examples would be immensely helpful. Thank you in advance for your support.