The following is a sample of my doc:
{"_id":{"$oid":“620496fdc0f56c21a0c0f5b5”},
“weight”:{"$numberInt":“100”},
“barcodeID”:“987654321”,
“registeredOn”:{"$date":{"$numberLong":“1644467965016”}},
“installedOn”:{"$date":{"$numberLong":“1644468159022”}},
“__v”:{"$numberInt":“0”}}
I am hoping to create a gauge with
Value: Number of Doc that has “installedOn” != null
Target: Total Number of Doc that has “registeredOn” != null
For now, all my “registeredOn” are not null so there is no problem with my Target. However, I do not know how can I achieve 1? With “distinct”, there will be a count for each value of “installedOn”.
This is a little tricky, but fortunately not impossible. The COUNT aggregation will count the number of non-missing values, but it does include nulls. If you were able to reshape your data such that the values you don’t want to count are not in the documents at all, it would work just with COUNT.
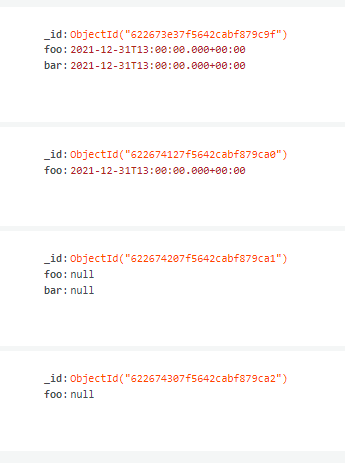
Assuming you want to keep the data as it is, it is possible to use an aggregation pipeline to remove the null values. I started with the following documents:
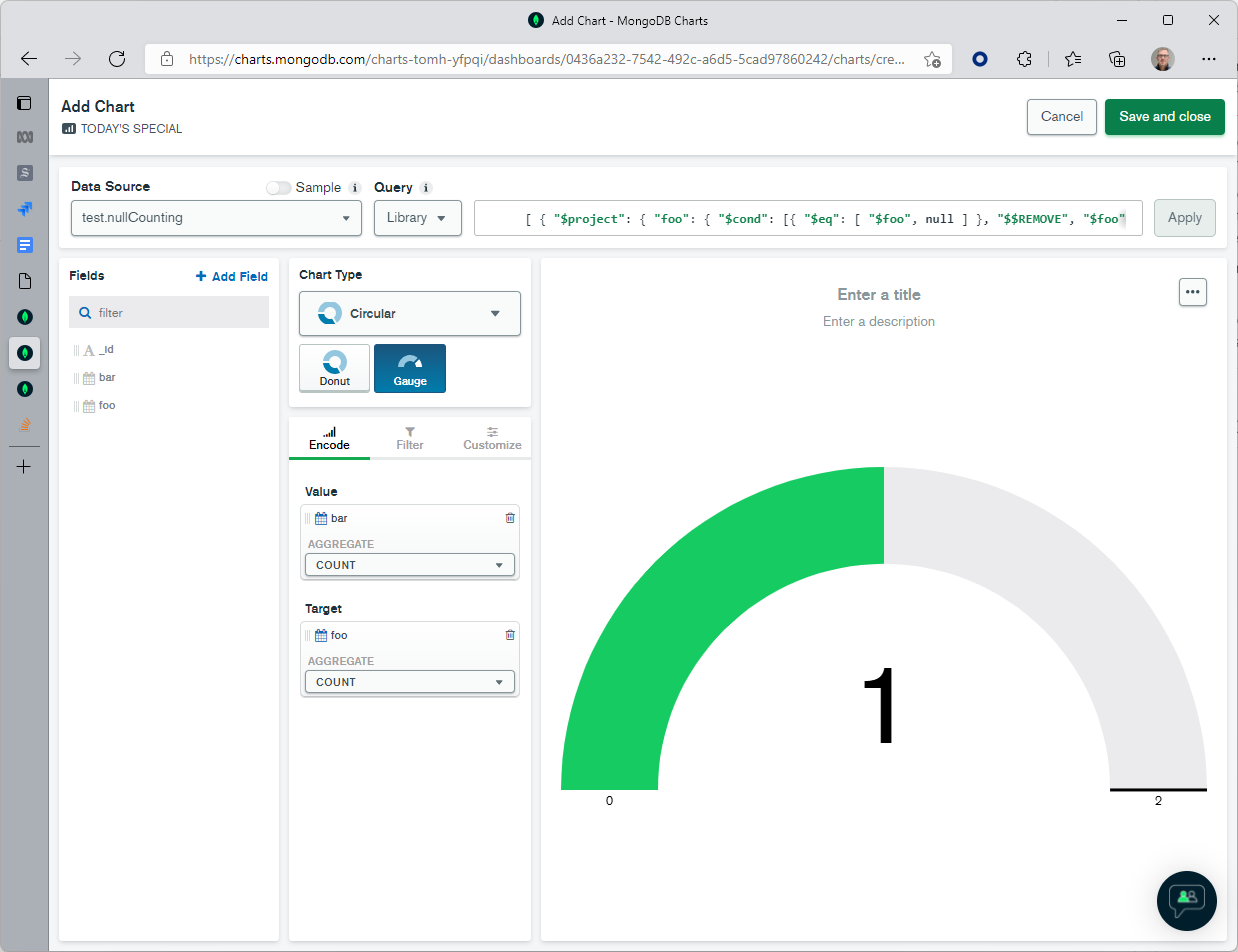
When I build a gauge chart from this, I get 2 bars and 4 foos, which is the number of non-missing values (but including nulls):