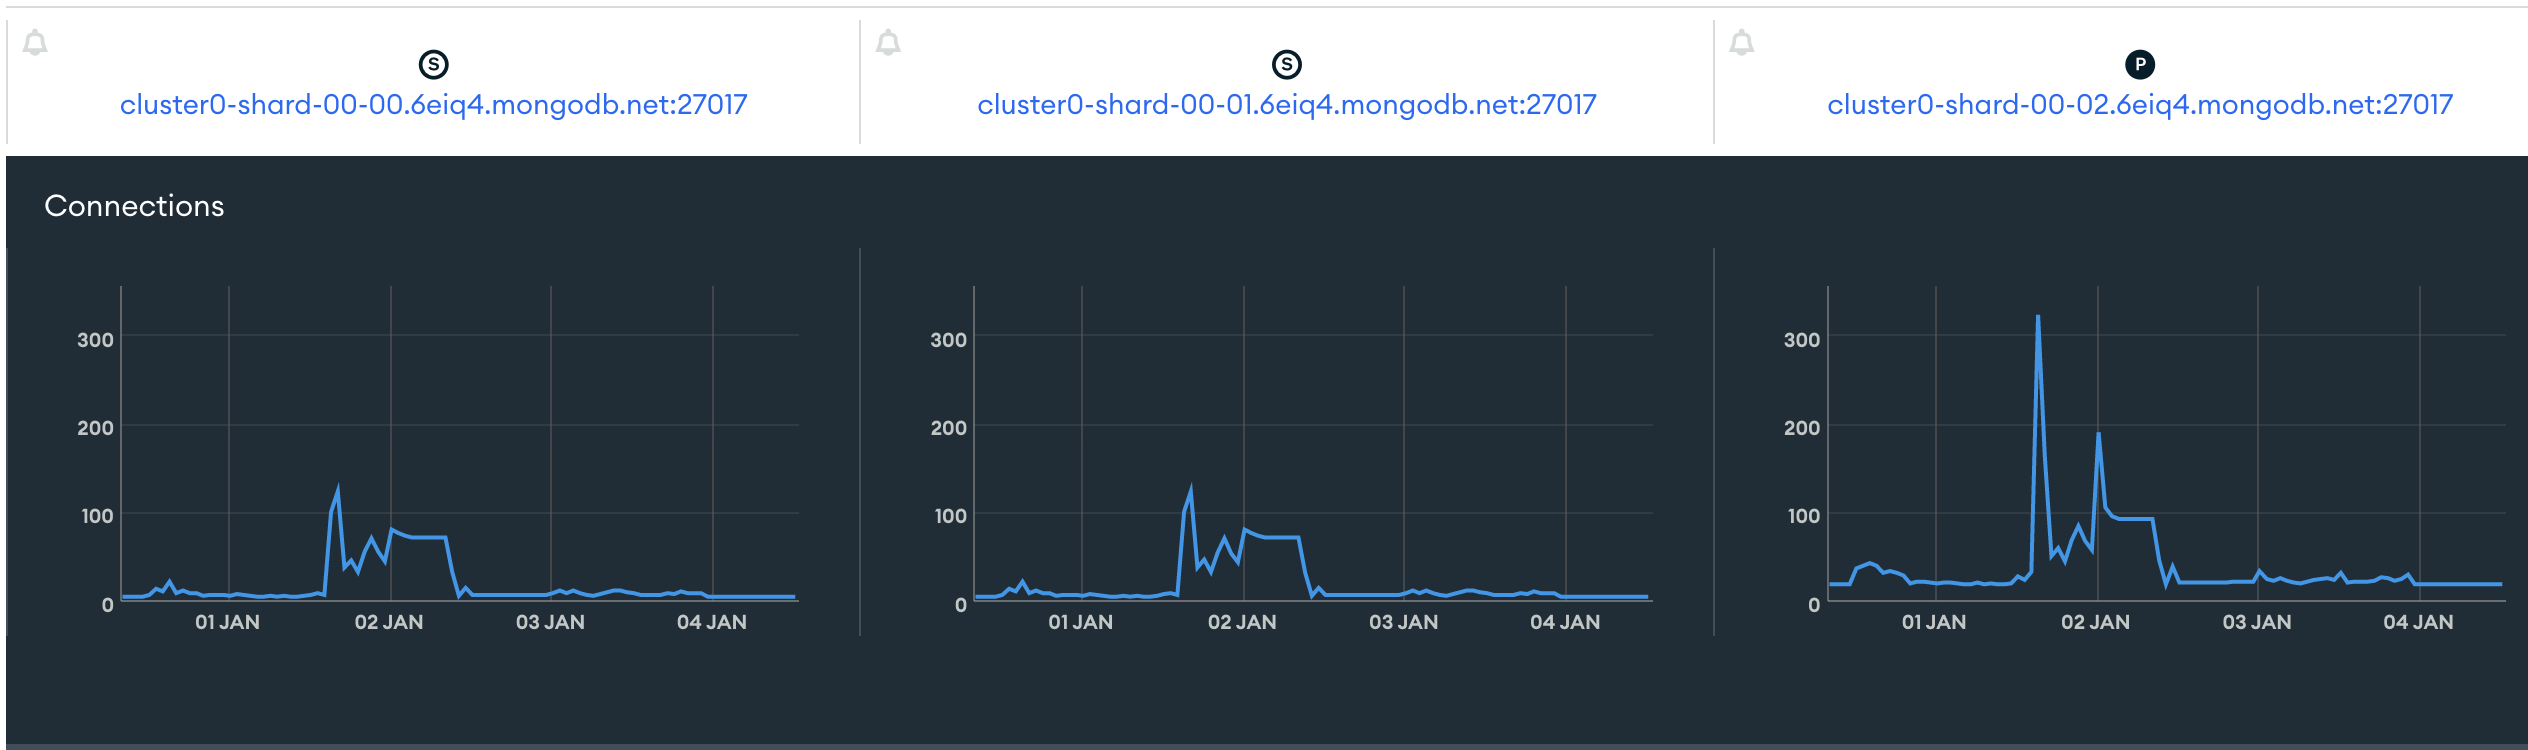
There isn’t a feature at the moment in the Atlas UI that will show you all the specific active connections to your MongoDB instance. You can however, review the available metrics (specifically Connections) to see if the connections surge up instantaneously or are gradually building up.
If you haven’t already done so, perhaps going over the Fix Connection Issues documentation may be of use. As mentioned in the docs:
Connection alerts are generally a symptom of a larger problem. Employing one of the strategies outlined above will fix the immediate problem, but a permanent solution usually requires either:
Examining your database applications for flawed connection code. Situations in which connections are opened but never closed can allow old connections to pile up and eventually exceed the connection limit. Additionally, you may need to implement some form of connection pooling.
When you close all application / instances connecting to the cluster, does the connections go back down to 0 within a few minutes? Also, vice versa, do the connections go up to ~500 after starting the application(s)?
I see I have at night time, when there are no builds running and I should have only one connection open (the 1 production server I have), but I have 20 on one shard, and 6 and 6 on the other two.
Any ideas why is that?
On the docs it says when you restart your application all connections automatically close, but that doesn’t seem to be the case.
Are you aware of any other servers connecting to the Atlas instance? You can try removing all network access list entries temporarily, wait a few minutes, and then see if the connection counts have dropped on the Atlas metrics page for your cluster.
Just to clarify, is this an M0 tier cluster? I assumed based off the number of connections alert you’ve prompted but would like to confirm.
Since we have no visibility into the actual inner workings of your deployment and CI system, it’s difficult to say what’s the “proper” number of connections. However, connections from the various driver(s) can differ but the connection counts can be affected depending on certain settings. For e.g. (from the Connection Monitoring and Pooling specs):
If minPoolSize is set, the Connection Pool MUST be populated until it has at least minPoolSize total Connections. This MUST occur only while the pool is “ready”. If the pool implements a background thread, it can be used for this. If the pool does not implement a background thread, the checkOut method is responsible for ensuring this requirement is met.
Assuming this is an M0 tier cluster, if you have removed all entries from the network access entries list and still believe the connections remain abnormally high then you can contact the in-app chat support team to check if there are any issues with the cluster. This troubleshooting step was to try and identify if the connections were coming from the application(s) for the M0 tier cluster.
Yes this is the free tier M0 cluster
I have removed the network access list and indeed the connections dropped to 0.
Since we have no visibility into the actual inner workings of your deployment and CI system
Not sure what you mean here
Deployment shouldn’t affect connections AFAIK, I have only one production server and one admin production server, and when they get deployed it should be just one more connection while we replace the old server with the new one (unless I’m missing something?).
And even when the CI isn’t active eg outside working hours, I still have sometimes 60+ connections some how.
So given that information, what would you suggest should be my next step?
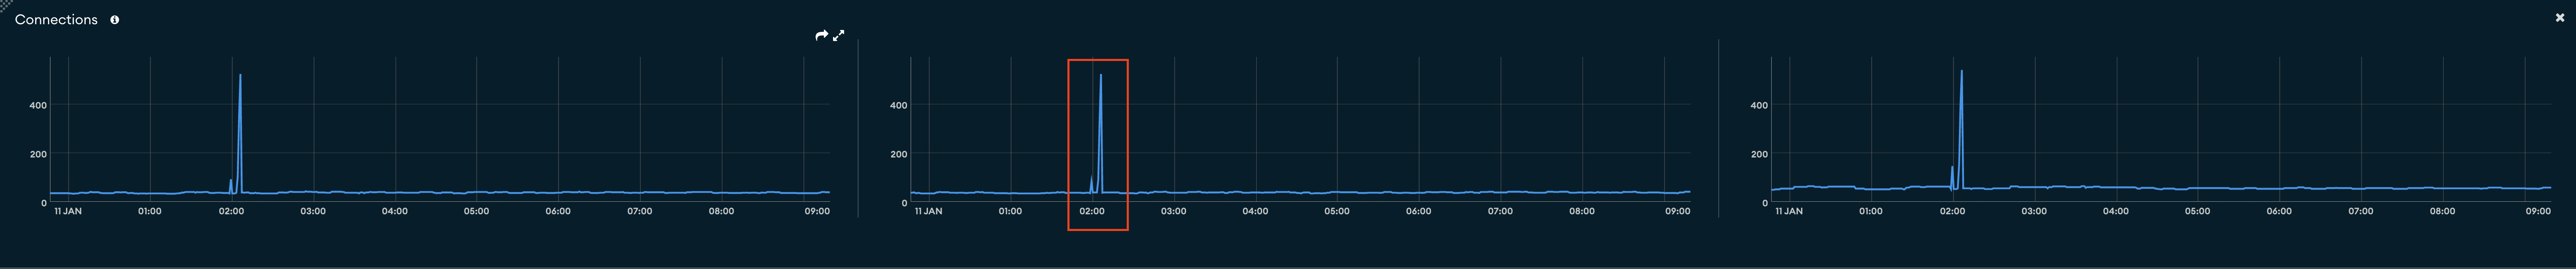
Connections do not necessarily work in this manner with specific regards to MongoDB and connection count. The following example is not exactly the same but may shed some more light onto this. In this example, I have a particular cluster which I connect to with mongosh from a single “server”. I connect with minPoolSize value of 500. After connecting successfully, we can see the connections increase by ~500 without even running a single operation from the mongosh connection:
In this example, I have a “single server” (or single client) connecting to my MongoDB replica set yet it alone has increased the connection count by ~500 without performing any operations.
So given that information, what would you suggest should be my next step?
Note that since this is a shared instance, what you’re seeing here may not reflect what you’ll see in a dedicated instance, and thus what normally happens in a dedicated instance may not apply in this case. There are certain limitations of shared instances, thus it may not fit all use cases. Anecdotally, I have seen M0 clusters connection count having a delay to reflect the actual connection into the servers, so it’s possible that if your CI system have multiple connect/disconnect routines, M0’s connection counting lagged behind and thus do not reflect the true connection count. This discrepancy adds up, and thus you’re seeing the warning.
With regards to your particular set up, you may wish to investigate how the CI/CD system(s) are connecting to the MongoDB instance. As mentioned previously, there also may be slight variation in each of the driver(s) and how they handle connections to the MongoDB instance(s). The root cause may be as simple as connections not being closed properly.
you may wish to investigate how the CI/CD system(s) are connecting to the MongoDB instance
Not sure what you mean by that, I literally do mongoose.createConnection once, and then I close the server, which according to mongodb docs should close all connections as well.
The root cause may be as simple as connections not being closed properly.
So again I’m not sure how this could happen since in the docs, at least as far as I understand, all connections are closed once the server closes, which happens multiple times a day every time we deploy.
You have a single app connecting to an M0 deployment
Your app is using Mongoose, and the app is diligent in closing connections (presumably using client.close() or similar)
You receive an error Connections to your cluster have exceeded 500 and you’d like to know why this is possible when you have a single app connecting to it
Am I following this correctly so far?
If yes, then I think this may be an artifact of an M0 cluster and how it counts connections. It’s a shared cluster, meaning that the telemetry on it may be lagging behind the actual numbers. This was alluded to by @Jason_Tran earlier (emphasis mine):
In my mind there are a couple of ways to investigate that theory further:
Try to point your app to a local testing deployment, and monitor the connection counts under a normal expected workload. Does it ever reach a high number? What’s the typical connection count? This would be the most reliable way to discover the true connection count number your app is making to the database.
Upgrade to a cluster that has a larger connection limit. See Connection Limits and Cluster Tier for more details about this. I would say that the dedicated clusters (M10+) would have more up-to-date telemetry and little to no discrepancy between the actual and reported connection count.
So as I said I have a few apps:
1 Production server
2 Production Admin server
3 Dev server
4 Dev server Admin
I do NOT call client.close, since according to the docs connections get closed on server shut off, and in anyway my connectinos jump to 60 on the first time I open my DB to connections.