I am encountering a problem building a kind of simple chart (count of something over time, filtered on one value). This works in Sample Mode but not on the full collection the collection is large and no index on the filter field. so the assumption is close to run for an index.
But this is not the case here, the problem already comes up when chart does the initial sample of the full collection.
Questions here are:
where can we get something like an explain for the resulting query, so that index creation gets reliable information
is there any other path to dig deeper having a kind of filtered view on information which might help form the log, profiler, metrics?
concerning the above mentioned issue I see nothing particular in the logs.
Try using the View Aggregation Pipeline command in the chart builder’s menu to get the full pipeline being used. (This might not work if you can’t even sample the collection)
Turn on the Atlas profiler and check the logs in the system.profile collection of the relevant database. This should give an accurate view of all queries hitting your cluster.
You are correct that indexes are mainly useful for filters, and those do not apply when the fields are sampled. If it’s slow, I suspect one or more of the following apply:
Your chart has a query in the query bar
Your data source has a pipeline attached
Your data source points to a View
You have a Lookup Field in your chart
In all of these cases, the pipeline will apply when the data is sampled. Depending on the size of your data and the indexing strategy, this could result in a slow query.
Also FWIW we are doing some work to eliminate the 90 second query timeout, but that will take us some time as it’s a fairly significant architectural change.
You are correct that indexes are mainly useful for filters, and those do not apply when the fields are sampled. If it’s slow, I suspect one or more of the following apply:
Your chart has a query in the query bar
Your data source has a pipeline attached
Your data source points to a View
You have a Lookup Field in your chart
In this case we have the collection as is. First thing is to use sample mode → limited to the 1000 docs, this works. With switching off the “Sample Mode” charts runs into a timeout error. Though the profiler is switched on I don’t see the sampling in the Atlas Profiler UI. I do see other queries to take care off but noting related to the charts issue.
I could get the schema exploration in Compass to finish after 20 min (!)
I also have an aggregation (count of items grouped by year/month) which runs 10s and touches all records. This is what I what to visualize but I can not pass the sampling step …
Any thoughts how to get that to work? On a mid term the schema will be optimized, but since the aggregation is acceptable performant I hope to get this visualized asap.
I like to take complexity out of this question. The core problem is as follows:
there is a brand new empty chart
I chose one specify collection to from the data sources to work with
the sampling starts
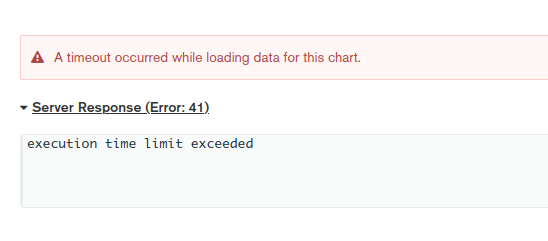
I get a timeout (as shown in the initial post)
In case I switch on the sample mode the sampling is reduces to 1000 documents (I assume) and this passes the sampling finishes with no error. But what ever I do I can not switch off the sampling mode with out getting a timeout. So I never can run any query against the full dataset.
I want now to understand what’s the reason for the timeout while sampling. Other (small) collections work fine. So I assume it is data/schema related, the profiler is switched on bit I do not see any specific spike. I would expect this since the timeout seems to be 90 sec.
Apologies for the slow response. This isn’t really a Charts question anymore; it’s a MongoDB query optimisation question and I’m trying to find someone more qualified than me to answer it.
But in the meantime I’ll help as much as I can. If I understand correctly, your first post was about a timeout while building a chart, but now you’re asking about a timeout while sampling the collection and you’re not even able to see the fields?
When you build a chart without a filter (or a filter on an unindexed field), the query must scan every document, even if you are doing a simple count. If the collection is large enough (and/or the cluster is underpowered), this scanning can take more than the 90 seconds that Charts is able to wait for a result.
The field sampling process involves looking at a random 50 documents from the first 10,000 documents in the collection. This should be quick, even on a large collection, unless it is a view or a data source with a pipeline. If this is a simple collection and is timing out, I don’t have an immediate explanation - it may need further investigation by our support team or someone with better knowledge of query optimisation.
Sorry I know it’s not a complete answer, but I hope it helps a bit.
Tom
This is correct, I want to simplify the issue and could break it down to the fact that the very initial sampling immediately after adding a source collection to a brand new chart creates the problem.
No chart here, just the initial sampling. I do not see any peaks / spikes in the profiler, how can we get further information where the sampling runs into problems? I am quite sure that it is a schema/data issue but to fix that I’d like to learn more about the root cause.
The collection has ~290k Documents with an avg. document size of 3.3 MB, so not very large.
The document size might be an issue but since there are many candidates to work on I like to lean more about the root cause and how to check that in a tool/log. So something beyond assumptions.
The machine is M60, running on a kind of low IOPs (completely fitting for the general day to day taks - is there a significant higher demand with charts? Also I saw while testing that the disk IO went high, do you use "allowDiskUse": true,? That might make things slow…
As mentioned in the prev. posting the sampling works fine, but at some time you have to switch off the sampling - than the problem arises.
So it is all down to get to know what and where to check to find out why the pure and initial sampling of a collection runs into a timeout.
The collection has ~290k Documents with an avg. document size of 3.3 MB, so not very large.
The document size might be an issue but since there are many candidates to work on I like to lean more about the root cause and how to check that in a tool/log
Could you try creating smaller Views of the documents in the collection and see if that would help with the timeout issue ?
Hello @wan
I will set a view up however as mentioned the db is not huge. And it seems to be a glitch dealing with docs which are not in the kbyte range. Sure Mbyte docs are considered an anti pattern but the db allows for up to 16 MB…
The aggregation I want to run and visualize returns in seconds outside of charts. The issues is that charts completely new, no aggregation noting, fails with the first click on the collection when it wants to sample. Going to Sample Mode and work on only 50 docs is fine. Going back to “full data” mode fails
Thanks for the extra info @michael_hoeller! It’s possible we haven’t tested this with very large documents. Can you give more info about the docs you’re dealing with? How big exactly are they? Do they have a large number of fields, or a small number of fields with a lot of data?
If the data isn’t sensitive, it would be helpful if you could send a dump of the data so we can try reproing the issue.