First my DB specs:
MongoDB Altlas cluster M40 (General)
Replica Set - 3 nodes
Version 4.2.18
I am running change streams against this DB (Secondary node),
one collection with 25k documents - 2 watches activated
second collection 2M documents - 2 watches activated
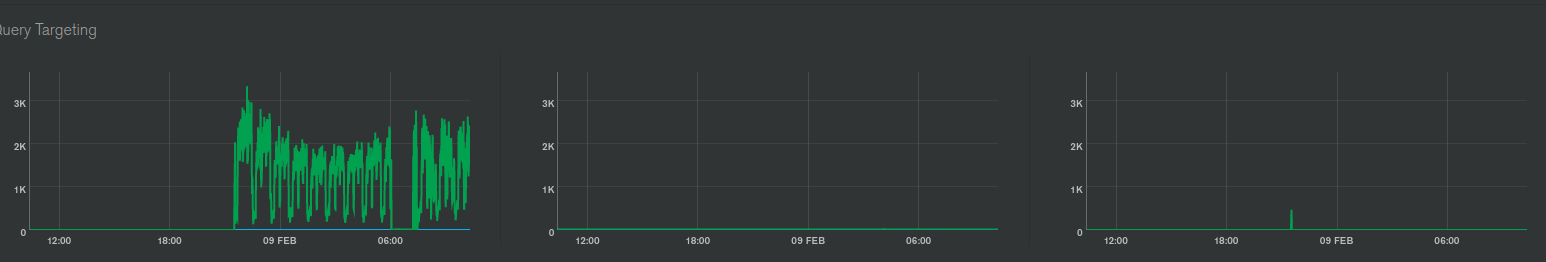
I see a rise in System CPU of 10%-15% and in
Scanned Objects / Returned metric of 1k - 3.5k in one specific secondary node.
Is that normal? should I be worried?
what is the suitable System CPU rate and Scanned Objects rate that is bearable?
Can you provide an atlas link to this cluster? (Only MDB employees can have read only access so don’t warry).
In general change streams are creating an oplog tailing cursor via an aggregation. So you might see scans related to reading of those oplog entries. It might be on a secondary if your read preference is secondaryPrefered or secondary (is that the case?)
10-15% CPU shouldn’t warry you that much, unless you see query response time impact…
I’ll check with my supervisor about the cluster’s link ( I should get approval for that obviously).
and yes, I set the read preference on “secondary” (not preferred).
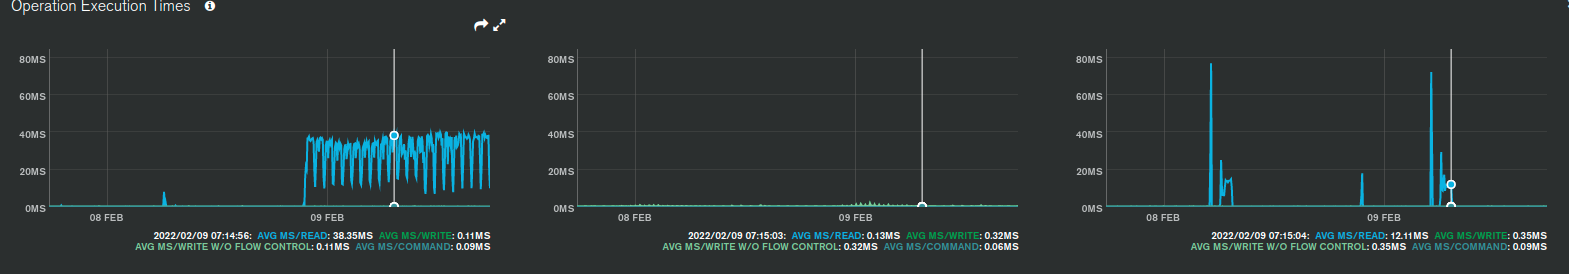
‘query response time impact’ - so if I don’t see any anomaly in “Query Executor” and “Replication Lag” metrics on an atlas it’s good enough or we have more indications to follow on peak hours?