Hi,
I want to know if we can created calculated field, based on two columns of each row.
I need to divide this two columns after charts make sum aggregation.
( DONT WANT AGGREGATION, Want calculated field based on aggregation done by charts )
And Dynamic Columns was grey cant add field.
Thanks for help.
Hey @Jonathan_Gautier -
This is possible, but as you discovered you can’t just use a simple calculated field. You’ll need to add a chart query that pre-groups the values, and then adds a calculated field from the groups.
Here’s an example query. Note that the query results in just a single document being returned, but you can use the calculated values on a chart.
[
  {
    $group: {
      _id: {},
      totalBeds: { $sum: '$beds' },
      totalBedrooms: { $sum: '$bedrooms' }
    }
  },
  {
    $set: {
      ratio: { $divide: ['$totalBeds', '$totalBedrooms'] }
    }
  }
]
1 Like
Hi @tomhollander, thanks for replying !
I have try to use your code :
[
  {
$group: {
  _id: {},
  totalCA: { $sum: '$ca' },
  totalSpend: { $sum: '$spend' }
}
  },
  {
$set: {
  ratio: { $divide: ['$totalSpend', '$totalCA'] }
}
  }
]
But got this error :
(InvalidPipelineOperator) Invalid $addFields :: caused by :: Unrecognized expression '$group'
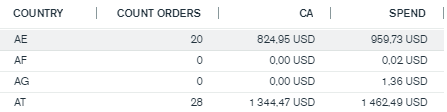
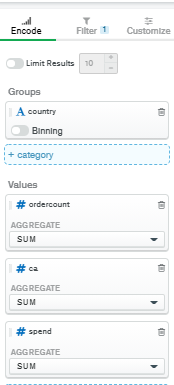
I want to add column and divide spend by ca.
Spend and Ca was already aggreation $sum.
And you didn’t see it but all data was by date, and when i filter with charts i can aggregate to have multiple days in one row with aggregation.
OK. Sorry the sample code I sent needs to go into the query bar, not into the Calculated Field dialog.
But seeing the chart you want, you’ll need to put the country into the _id of the group so you get a separate line for each country. If you want to do any filtering, you’ll also need to add additional $match stages in the query.
Basically with the approach I’m showing you, you need to do all of the data processing in the query bar, which will result in a few pre-calculated fields you can put onto your chart.
HTH
Tom
Yes but if i want to use Charts Filters ? How can i manage this case ?
The filters in the filter pane are applied after the query bar in the pipeline. While you may still find a way to use it, I suspect for your case that you would be better off putting the filters into the query bar, i.e. by creating $match stages early in the pipeline.
I want viewer can use filter of dashboard and can change date range. 
I know it’s was tricky, but i dont understand why i cant calcul field after agregation was done.
Just want way to post-process data and make formula like Excel can do 
Here divide two field of one row ( data generated by aggregation $sum )
Hi @Jonathan_Gautier -
Thanks for the additional information. Unfortunately the approach I’ve outlined is not compatible with dashboard filters. Since the dashboard filters apply after the groupings in your query, they are too late to affect the results. I’m afraid I can’t think of a solution that meets all of your requirements, although we’ll think about how we can extend the product to support this in the future.
Tom
1 Like
Hi @tomhollander, Thanks for your help !
Did you add this idea in mongo feedback ?
Hello @tomhollander,
Is there any development regarding this? As I understand totals in the table are useless for any kind of calculated ratio.
Many thanks.
Michal