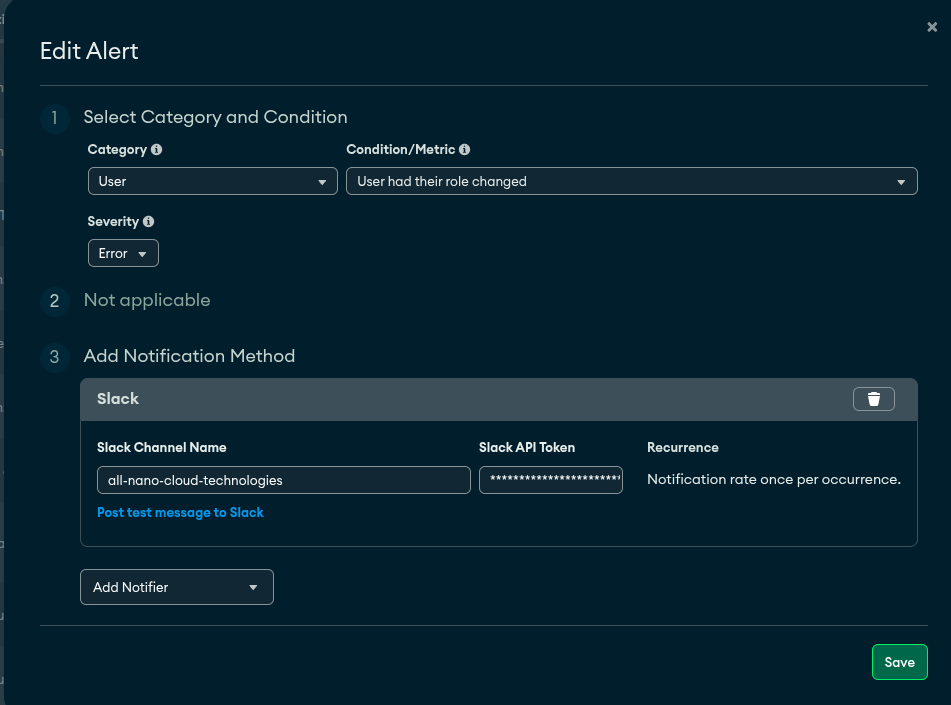
Hi — I’m using a personal Atlas account (no paid support). I configured an alert (Severity = Error) but the webhook payload shows status = “INFORMATIONAL”. This breaks our downstream notifications.
Project: pointsville-atlas-alerts-test
Project / Group ID: 668b6126910c042ef24a5929
AlertConfigId: 68959f769184275385be033b
Example Alert ID: 68adc1feef552379cb6bb9c7
Event type: USER_ROLES_CHANGED_AUDIT
Observed payload (redacted):
{
“eventTypeName”: “USER_ROLES_CHANGED_AUDIT”,
“created”: “2025-08-26T14:17:34Z”,
“alertConfigId”: “”,
“groupId”: “”,
“id”: “”,
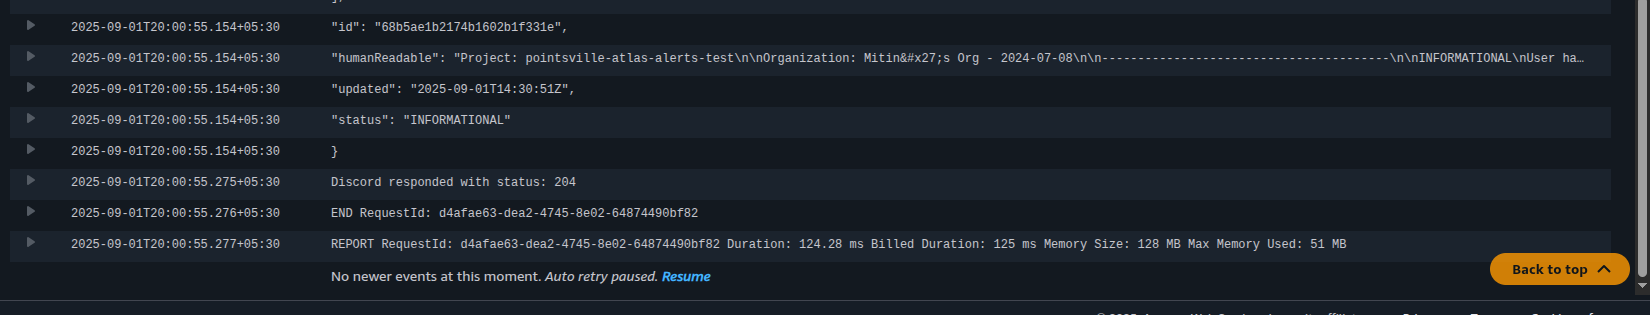
“humanReadable”: “…\nINFORMATIONAL\nUser had their role changed\n…”,
“status”: “INFORMATIONAL”
}
Expected: Because I set Severity = Error in the alert config, the webhook should indicate ERROR/CRITICAL (or otherwise expose configured severity), so downstream systems can escalate.
What I’ve tried:
-
Verified alert config has Severity = Error in Atlas UI (screenshot attached).
-
Confirmed webhook payload in CloudWatch (log snippet attached).
-
Implemented a Lambda to reclassify events (works as a workaround), but would like to understand whether this payload behavior is expected or a bug.
Questions:
-
Is
USER_ROLES_CHANGED_AUDITintrinsically classified as INFORMATIONAL in Atlas (regardless of UI Severity)? -
If not, is there any setting or documented mapping to ensure the webhook payload reflects the configured Severity field?
-
Any recommended workaround besides filtering/overriding in my webhook receiver?