Hi @Avinash_Prasad !! thanks again for your answer.
I wanna share with you, please tell me If I’m using correctly the “dashboard filters” (with JS SDK).
Right, I allowed all fields:
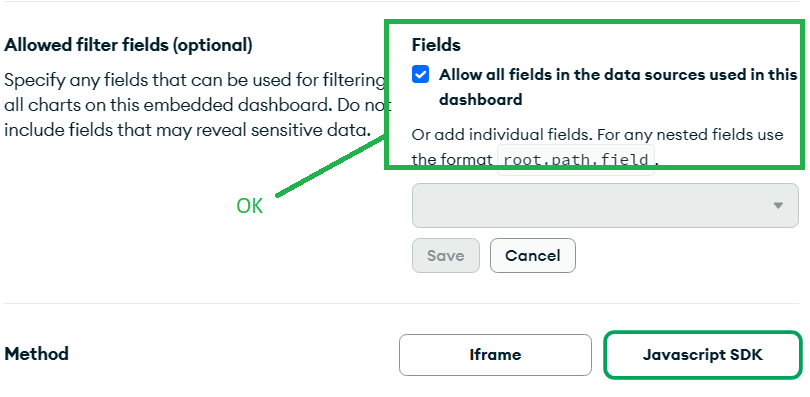
I’m working with React JS, this is my code, as you can see, I’m using “Filter: {}” option
const MyDashboard = ({dashboardId, height, width}) =>{
    const date1 = new Date('2024-02-20')
    const sdk = new ChartsEmbedSDK({baseUrl: 'https://charts.mongodb.com/MybaseurlXXXX'});
    const chartDiv = useRef(null);
    const [rendered, setRendered] = useState(false);
    const [chart] = useState(
        sdk.createDashboard({
            dashboardId: dashboardId,
            height: height,
            width: width,
            filter: { "createdAt": {$gte: date1} },
        }));
So, I can see my dashboard embedded in my webpage, but my Filter is not working, dashboard is showing me all the data without my date filter.
Thanks in advance.