Hello there. Currently, I’m just playing with embedded Atlas charts.
One simple example: I have an embedded chart size of 300x300 pixels. If my bar chart grows, can I add scroll bars to my chart and see the complete chart?
Hi @Orlando_Herrera. An embedded chart always scales to fit in an iframe. But it should be possible to use custom CSS to enable scrolling.
Another option is using an embedded dashboard to maintain the size of a chart inside it and introduce scrolling using the fixed height and width options.
Currently I’m using JavaScript SDK (not IFrame)
But if an embedded dashboard is used, what about filters?
Can I use custom filters in the same way I use charts ? Example:
<Chart height={'200px'} width={'500px'} filter={{"createdAt": {$gte: new Date(MyDate1)}} chartId={'MyId'} />
You have two options on using filtering inside a dashboard.
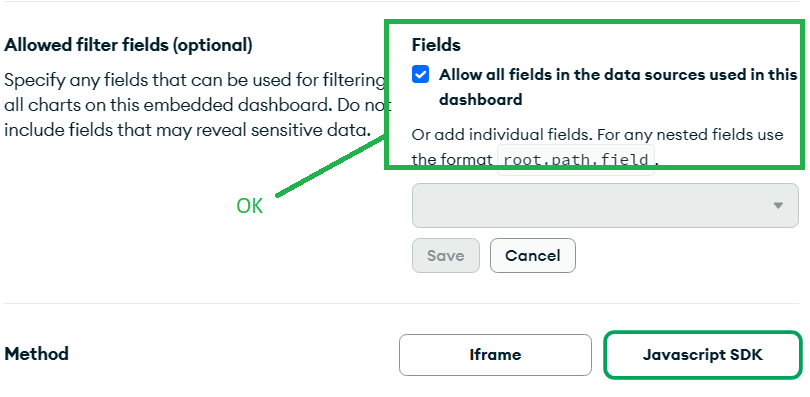
We have just released dashboard filtering on embedded dashboards. So if all your charts in the dashboard use a single data source, then you can easily use dashboard filtering to filter all charts. See the attached gif to switch it on.
You can start using this feature in SDK from Monday onwards. We are updating the SDK on Monday.
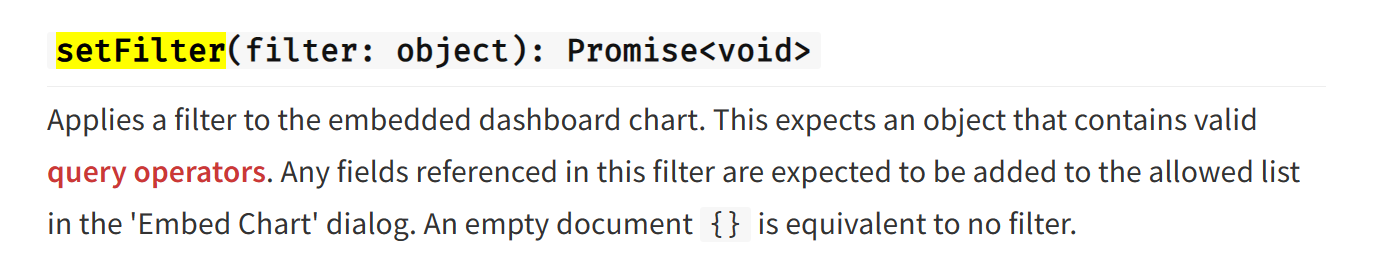
You can individually filter each chart in a dashboard by using the below method.
Hi @Avinash_Prasad !! thanks again for your answer.
I wanna share with you, please tell me If I’m using correctly the “dashboard filters” (with JS SDK).