We are getting an alert about the connection limit being reached. We are using Mongo Atlas App Service as a GraphQL service to access MongoDB.
We have a Serverless Cluster and a 100 connection limit. We are frequently reaching the connection limit in the development phase, Currently, we have only 2-3 users active on the website.
Can you please suggest why we are reaching the connection limit and how we can overcome it?
Thank you for the question. In order to better assist you can you please answer the following questions:
Can you please explain how you configured a connection limit of 100? All MongoDB Atlas Serverless Instances Serverless instances can support up to 500 simultaneous connections.
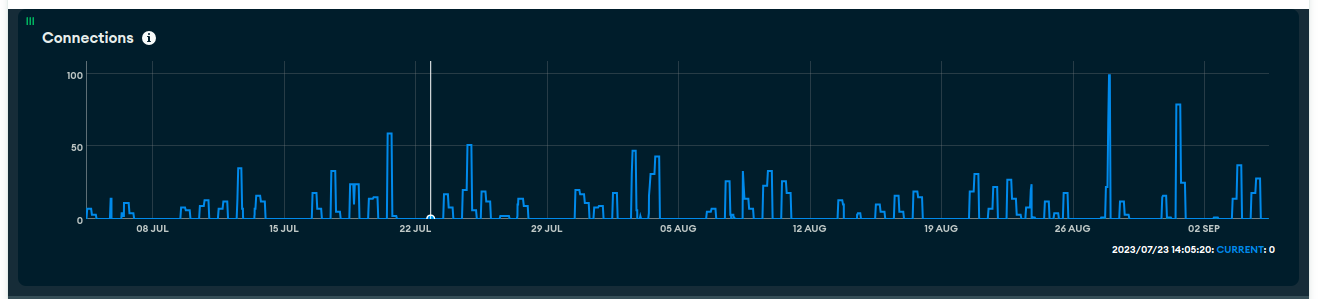
We didn’t configure a connection limit of 100 but we got an alert that 80% limit reached on 28 Aug 2023 so we checked the Monitoring Graph for 28 Aug 2023 as in the image
Would you happen to know how many queries you were sending when you noticed the connection spike on August 28th? The number of connections are proportional to how heavy your workload was (in addition to being correlated to the number of users).
Yes, we want to know how many queries we were sending when we noticed the connection spike on August 28th.
Also, how can we control the connections as we are using MongoDB app Graphql service and we have no control over making connections and closing connections.
Currently, we are in the development stage and we have only 4-5 users active on the website so I don’t think the user workload enabled connection
Can you please let us know the exact reason and give suggestions to overcome this problem?
Atlas GraphQL is a fully-managed, serverless hosted layer with built-in support for data permissioning, authentication, and relationships across collections. With that being said, we manage the connections for you, and will pool connections in order to improve data access performance to your cluster when requests are made through App Services.
GraphQL opens a connection count relative to what your cluster can handle, but defaults to a certain number for serverless instances. It would be great to know how many requests you were making when you received the alert – this could let us know whether we should adjust our settings internally for the connection pool size.
Thanks, but we are not sure about the number of requests and also unable to get logs on 28th August as App Service logs can be searched for the past 10 days so can you please suggest how we can get how many requests were made on 28th August?
We don’t have access to this data as we only save logs within a 10 day timeframe, but if this spike happens again, please let us know asap so we can look into your workload. Thank you!