Aggregate pipeline, why scan all the items

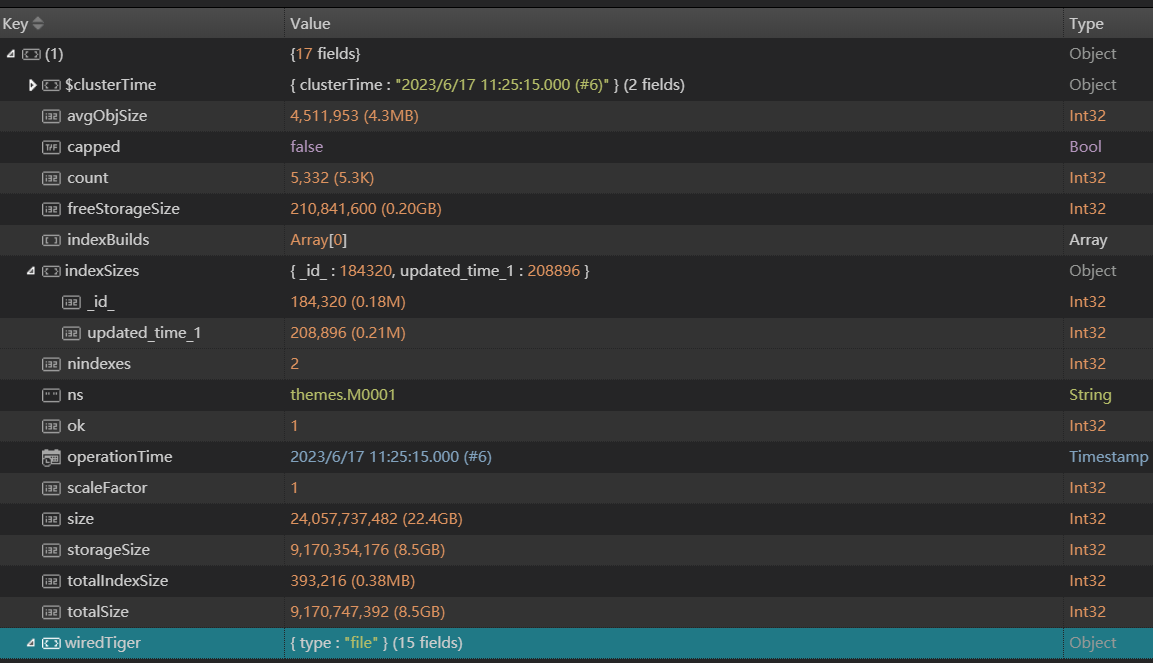
One of my collection is large, and the size about 8.4G , about 5600 items.
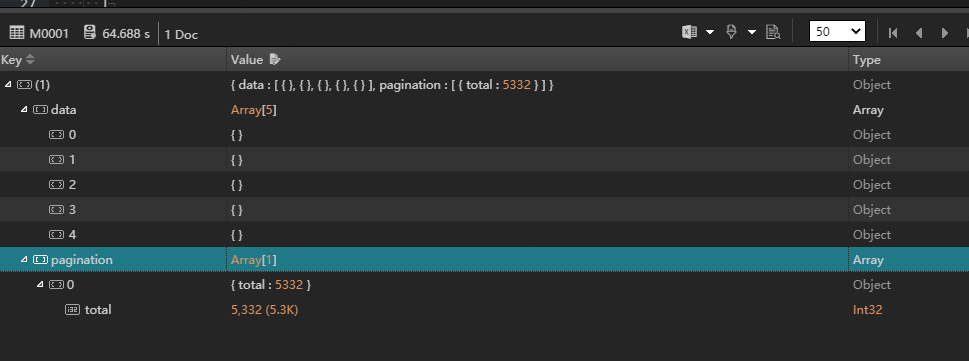
And I use the aggregate pipelines to make a api for pagination, but the query is so slow.
The query command is below:

db.M0001.aggregate([
    {
	"$match" : {
		"updated_time": {"$gt": ISODate("2010-05-01T00:00:00.000Z")}
	}
},
  {
    "$sort": {
      "updated_time": -1
    }
  },
  {
    "$project": {
      "GC0004440E_Y0Y2021010120211231": 1,
      "_id": 0
    }
  },
  {
    "$facet": {
      "data": [
        {
          "$skip": 300
        },
        {
          "$limit": 1000
        }
      ],
      "pagination": [
        {
          "$count": "total"
        }
      ]
    }
  }
], {explain: true})

And the explain is shown in the jpg, it takes about 62 seconds:

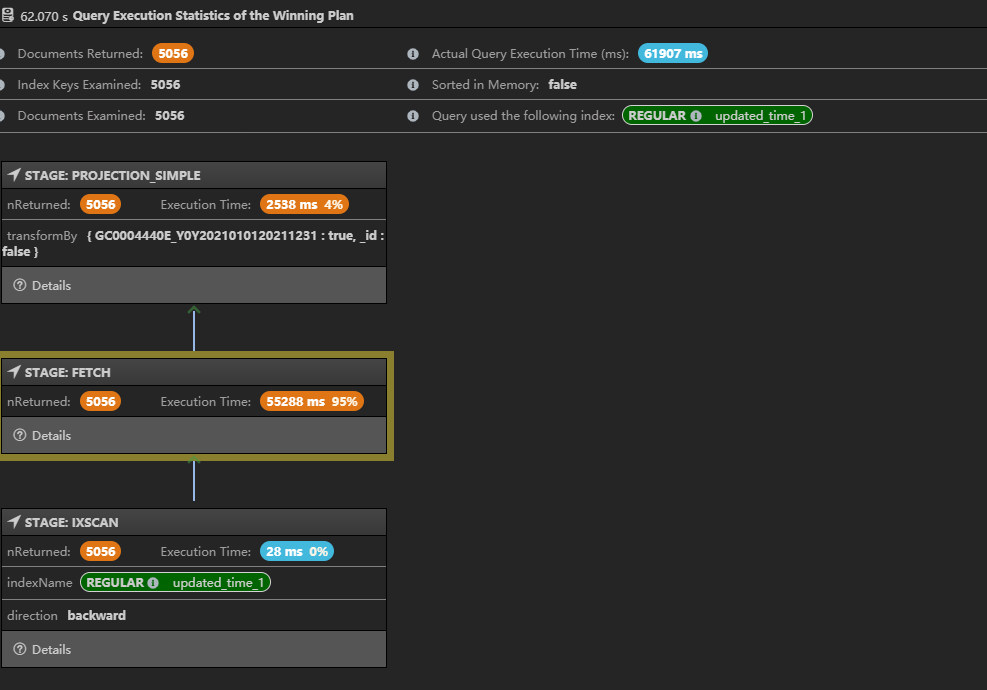
But I can not know, why it’s so different from the simple find command shown below:

db.M0001.find({}, {"GC0004440E_Y0Y2021010120211231" : 1}) \
.sort({updated_time:-1}).skip(300).limit(1000).explain('executionStats')

it takes about 10 seconds.

Can anyone give me some suggestions, thanks!
Plus:
the version of mongo is: 4.4.10

Hey @dean.du_2023,

Thank you for reaching out to the MongoDB Community forums.

Could you please provide us with the sample document and the indexes of the collection you are currently working on?

Additionally, it would be helpful if you could share the output of the

Based on the screenshot shared, it seems that the index scanning (IXSCAN) took only 28ms, while the majority of the time (55s) is spent fetching the data, specifically retrieving the full document based on the index key. This is typically caused by hardware constraints. Could you please share your hardware configuration for the deployment? Also, let us know where the MongoDB server is running. Are you using Docker or some kind of virtual machine?

Best,
Kushagra

the result of the db.Mooo1.stats() is shown below:

And the result json of the explain().aggregate([...]) is following:

{
	"stages" : [
		{
			"$cursor" : {
				"queryPlanner" : {
					"plannerVersion" : 1,
					"namespace" : "themes.M0001",
					"indexFilterSet" : false,
					"parsedQuery" : {
						
					},
					"queryHash" : "9E9253CF",
					"planCacheKey" : "9E9253CF",
					"winningPlan" : {
						"stage" : "PROJECTION_SIMPLE",
						"transformBy" : {
							"GC0004440E_Y0Y2021010120211231" : true,
							"_id" : false
						},
						"inputStage" : {
							"stage" : "FETCH",
							"inputStage" : {
								"stage" : "IXSCAN",
								"keyPattern" : {
									"updated_time" : 1
								},
								"indexName" : "updated_time_1",
								"isMultiKey" : false,
								"multiKeyPaths" : {
									"updated_time" : [ ]
								},
								"isUnique" : false,
								"isSparse" : false,
								"isPartial" : false,
								"indexVersion" : 2,
								"direction" : "backward",
								"indexBounds" : {
									"updated_time" : [ "[MaxKey, MinKey]" ]
								}
							}
						}
					},
					"rejectedPlans" : [ ]
				}
			}
		},
		{
			"$facet" : {
				"data" : [
					{
						"$teeConsumer" : {
							
						}
					},
					{
						"$skip" : 2000
					},
					{
						"$limit" : 1000
					}
				],
				"pagination" : [
					{
						"$teeConsumer" : {
							
						}
					},
					{
						"$group" : {
							"_id" : {
								"$const" : null
							},
							"total" : {
								"$sum" : {
									"$const" : 1
								}
							}
						}
					},
					{
						"$project" : {
							"total" : true,
							"_id" : false
						}
					}
				]
			}
		}
	],
	"serverInfo" : {
		"host" : "mongo01",
		"port" : 27017,
		"version" : "4.4.10",
		"gitVersion" : "58971da1ef93435a9f62bf4708a81713def6e88c"
	},
	"ok" : 1,
	"$clusterTime" : {
		"clusterTime" : Timestamp(1686972731, 6),
		"signature" : {
			"hash" : BinData(0,"QxBw4lVSq6gixefHxluUxiO2voU="),
			"keyId" : NumberLong("7190173993972793345")
		}
	},
	"operationTime" : Timestamp(1686972731, 6)
}

One sample of the items of collection was uploaded to one cloud driver:
One sample to download

Thanks for your help! Best regards!

Hey @dean.du_2023,

Thank you for sharing the details. Could you please share the output of the following command: db.M0001.explain('executionStats').aggregate([..])? Additionally, could you provide information about your hardware configuration for the deployment and confirm where the MongoDB server is running? Also, are you using Docker or any virtual machine for the setup?

Furthermore, based on the sample documents you shared, it appears that each document contains approximately 30K+ field-value pairs. Can you please confirm this?

I’m asking for this information so that I can hopefully reproduce what you’re seeing and come up with some recommendations.

Regards,
Kushagra

ok, my mongo is running on a single server, and set up with Docker.
The configuration is shown below:

CPU: 8 core
Memory: 16 G

And you are right about that each document contains 30K+ k-v pairs. Some documents contain even about 100k+ k-v pairs.

And the result of the command is about like the following png:

Thanks for your replay.
Regards,
Dean