At MongoDB, we want to (honestly) tell our users that each new version of our software is faster than the previous version. We also want to be able to explain why. We definitely do not want to learn that a release is slower (we have a performance regression) from our customers telling us after discovering it for themselves. In order to do this, we need to understand the performance of our software, detect performance changes early, and aggressively redress the root cause.
We have invested significantly into building a performance testing system to achieve these goals. This includes creating a large number of performance tests, automating the running of those tests, and building tools to diagnose performance regressions when we find them. Those tools and tests are not enough by themselves: they produce an overwhelming amount of data. That data needs to be analyzed to determine if the performance changed. We could not process it all. We have developed new tools to process the data, using advanced statistical techniques to detect real performance regressions and identify the causes of those regressions.
Where we started
We built our original performance testing system in 2015. It ran a collection of performance tests directly in our CI system (Evergreen). We automated every step of running a test and collecting the results. That left the hard part: making sense of the results.
Computers are fascinating things, built up from a huge number of simple and deterministic components. However, the interactions between those simple components lead to the emergence of non-deterministic behavior. As computers get more complex, the emergent behavior becomes more pronounced. The net effect is that when you run a program twice, the two executions will differ (i.e. one may take longer), even when run on the same machine.
The problem gets even harder when you go from running on a single computer, to multiple computers in a distributed system. Network latencies will vary depending on the state of the network switches and other traffic on the network. The combination of each computer's variability combined with the variability of the network leads to more variability. MongoDB is a distributed system. When we test the performance of MongoDB, we have to address all of these issues.
For performance tests, these differences show up as different measurements of performance. Your program may take more or less time to run. It may execute more or fewer operations within a period of time. You may see more or fewer slow operations. We call this phenomenon run to run variation or measurement noise. Run to run variation makes it harder to determine if changes to the software made the software intrinsically faster or slower. Thus, we did an enormous amount of work to limit the measurement noise in our tests, both in the original project, and in subsequent projects.
Still, no matter how hard anyone tries, there will always be run to run variation. This presents a challenge when we want to interpret our performance results (or if you want to interpret your performance results). Maybe we are comparing two versions of our software and want to know which one is faster. If we have results that are 5% faster on the new version, is that due to our software being 5% faster? Or is the 5% due to run to run variation? Or worse, is the 5% change due to 10% run to run variation combined with our software actually being 5% slower?
When we started, we only had a few performance tests. We manually inspected the results and could understand if and when the performance changed. However, as we added more tests, and more results per test, human inspection became less effective: we missed things and it was hard and unsatisfying work.
We automated comparing the performance of one version of the software to another very early in the development of our system. We wrote software to compare the new performance results to older performance results. If the results changed more than 10%, we flagged it and had a human look at it.
Using a direct comparison was common practice in the industry. It was also awful. The comparisons missed small regressions, they flagged a lot of false positives on noisier tests, and sometimes they flagged real things, but at the wrong time. The automated comparisons were much better than manual inspection, but still awful.
We continually built improvements to make the system less awful. We had a system to increase the comparison threshold (from 10%) for noisier tests, and a system to reset the comparison when there was a change in performance (i.e., compare to the new normal). These changes improved the system, but they did not fundamentally overcome the challenges we faced.
Solving the right problem
Along the way, we realized we were trying to solve the wrong problem. Our automated comparison was answering the question: “Has measured performance changed more than 10% between these two versions of software”. What we really wanted to answer was “Which software changes altered performance (for better or worse)”. Those two questions overlap for large performance changes in low noise environments, but they differ on noisy tests or for small changes in performance.
The second question (“which software changes altered performance?”) focuses on detecting changes in a measured value over time. This question maps to a known problem called change point detection. Change point detection is the problem of finding when changes in values occurred in time (time-series) in the presence of noise or other confounding variables. For example, it’s used to detect changes in behavior on such things as electricity consumption, population totals, local weather, and stock prices. There’s a lot of existing work on change point detection, so we just needed to pick the best existing work, implement it, and put it into production. Simple, right?
Well, maybe not. We did not know what was the best existing work, and we did not know if it would fix our problems. So, we did some research, identifying likely techniques and collecting papers on them. The papers accumulated and stayed on my desk, because I didn’t have time to dive into a speculative project when there were plenty of things that needed to be done NOW.
Enter an intern
During the summer of 2017, two interns joined us on the performance team. They spent the summer working with us on our performance testing infrastructure. Both of them were great, giving our work an extra push forward.
We encourage our interns to learn and grow. One way we do this is by explaining what we are doing and why we are doing it. We explain the larger context of the work. This naturally leads to discussing open challenges. One of our interns asked if they could read that stack of papers sitting on my desk (of course they could). Towards the end of the summer, he had completed his summer project early. Further, he had read the papers, understood them, and asked if he could make a prototype! In particular, he had gone through the complex math of the papers, and figured out how that math could be implemented in software.
He built a prototype. It was limited, but it proved that the concept could work. The algorithm clearly found the changes in the sample traces we created, and did not get confused when run on sample data containing random background noise. Based on this initial success, we scheduled a larger proof of concept project to integrate the algorithm with our production system. We compared this second proof of concept with the existing comparison code, and determined it was MUCH better. We then did the work to get the algorithm in production and update our processes to use it.
Our production system today
When we started in 2015, we ran only a handful of tests and only a handful of people used the performance infrastructure directly. Today we run hundreds of distinct performance tests, generating over 100k distinct results per software commit. Today, everyone who develops MongoDB interacts with our performance testing infrastructure.
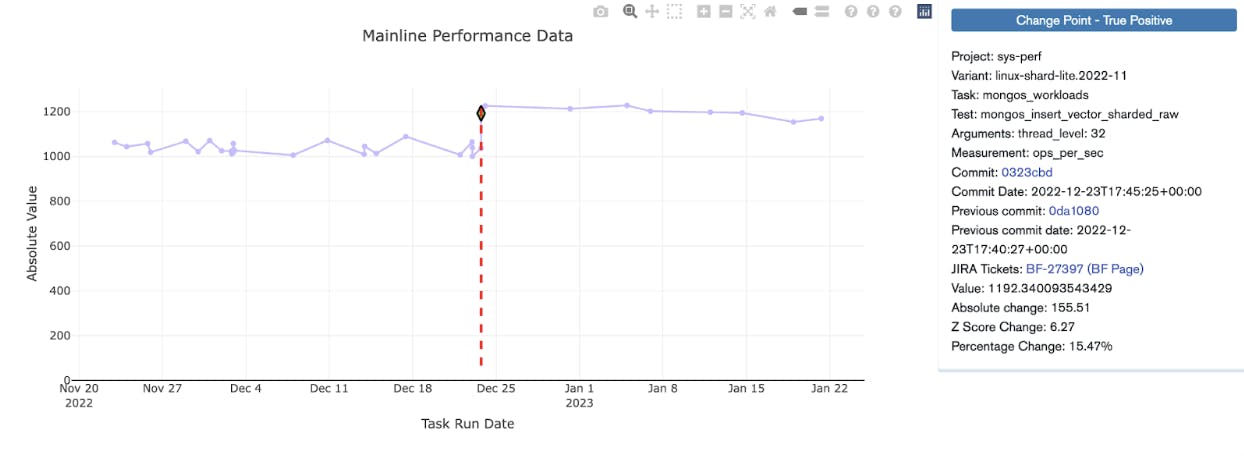
When a developer commits a change to MongoDB, tests are run. Upon completion, change point detection is used to detect performance changes (improvements and regressions). A dedicated team triages these changes, isolates them to specific commits, and assigns these changes to developers to investigate. In the case of improvements, the developers confirm that the change was expected, or investigate the change to understand why the performance got better. Sometimes things get faster because of bugs – we have found bugs this way.
Our system is good at detecting regressions and our engineers are good at fixing them. Even better than fixing a regression, is preventing a performance regression from ever being committed to our development branch. Developers can test their proposed changes before committing the changes, using something called a patch build. In this way, the developers can make sure they are not introducing new performance regressions, verify a fix, or confirm an optimization before committing their code.
Advancing science!
At MongoDB we take pride in developing a database and a database platform that empowers developers to make applications that change the world. We depend on our performance testing infrastructure to ensure we ship a performant database. We are proud of the performance infrastructure we have built and the impact it has had on the software we ship to our users.
We do not do any of this work in a void. At MongoDB we benefit from being part of several communities, and we want to support these communities. It is for this reason that most of our database source code is publicly available and our JIRA project for database development is also public.
When we developed a new way of finding performance regressions in our software, we didn’t hide it away. Instead, we shared it with the community, and will continue to do so as we learn and progress. This started with submitting a paper called “The Use of Change Point Detection to Identify Software Performance Regressions in a Continuous Integration System” to the International Conference on Performance Engineering (ICPE). It has continued with more papers (Creating a Virtuous Cycle in Performance Testing at MongoDB, Automated system performance testing at MongoDB) and presentations.
These talks and presentations have helped the community, but they have also helped us. By sharing and participating in the community, we have more people thinking about our problems. We’ve had the best minds in performance engineering in academia sharing ideas and suggestions with us on how to improve our technology!
Often the ideas build on each other. One such idea led to the creation of the Data Challenge Track at ICPE in 2022. Building on our papers, we were able to open up our performance test results as a shareable artifact. The data challenge itself was simple: do something interesting with our performance test data. Researchers were thrilled to have industry data to evaluate and demonstrate their ideas. We were thrilled to have researchers working on our problems. In the end, it led to four strong papers which have impacted how we test performance at MongoDB.
We continue to work on sharing our data and learnings. We have an ongoing collaboration within the SPEC Research Group to create better datasets and algorithms for detecting performance regressions. The group is combining our data with other industry datasets and curating the data. The results will enable researchers to understand the performance and accuracy of current algorithms, test new algorithms, and clearly show any improvements. All using real industry data from us and other companies.
In each of these interactions, the community wins and we win. By sharing our data we enable better research, we get to take advantage of that research, and the research is better aligned with our needs.
Investing in the future
Of the two interns mentioned in this post, one is now a full time employee of MongoDB, and the other is pursuing a Ph.D. in computer science at Columbia. One is directly improving our software, and the other one is improving the theory and tools we use to build our software. We are very proud of both of them.
The MongoDB database is faster today because of their work on our performance testing infrastructure. Thanks to that infrastructure we better understand why the database performs the way it does, why that performance changes, and when that performance changes.
We continue to invest in and improve this critical piece of our infrastructure. We have teams dedicated to extending and improving it. We lean into our academic interactions to improve the state of the art for everyone. And we invest in the people who work on these systems (interns included).
We hope you consider using these techniques yourself and letting us and the community know how it goes for you. If you are an academic, please improve the theoretical underpinnings of this entire space – we are happy to talk to you about it. And if the problems and software described in this post sounded interesting to you, we are hiring! Come join us and help us solve these problems.
If you would like to learn more about our performance testing environment, check out some of our papers and presentations:
- Papers
- ICPE2020 The Use of Change Point Detection to Identify Software Performance Regressions in a Continuous Integration System
- DBTest.io 2020: Automated System Performance Testing at MongoDB
- ICPE 2021: Creating a Virtuous Cycle in Performance Testing at MongoDB
- Presentations
- ICPE2020 The Use of Change Point Detection to Identify Software Performance Regressions in a Continuous Integration System [Video] -- [Slides]
- ICPE 2021: Creating a Virtuous Cycle in Performance Testing at MongoDB [Video] -- [Slides]
- CMU Database Seminar Series: How to Waste Time and Money Testing the Performance of a Software Product [video] -- [slides]
- Performance Advisory Council 2021: Creating a Virtuous Cycle in Performance Testing [Slides]
- ICPE2020 The Use of Change Point Detection to Identify Software Performance Regressions in a Continuous Integration System [Video] -- [Slides]