On the MongoDB Performance team, we use EC2 to run daily system performance tests. After building a continuous integration system for performance testing, we realized that there were sources of random variation in our platform and system configuration which made a lot of our results non-reproducible. The run to run variation from the platform was bigger than the changes in MongoDB performance that we wanted to capture. To reduce such variation - environmental noise - from our test configuration, we set out on a project to measure and control for the EC2 environments on which we run our tests.
At the outset of the project there was a lot of doubt and uncertainty. Maybe using a public cloud for performance tests is a bad idea and we should just give up and buy more hardware to run them ourselves? We were open to that possibility, however we wanted to do our due diligence before taking on the cost and complexity of owning and managing our own test cluster.
Performance benchmarks in continuous integration
MongoDB uses a CI platform called Evergreen to run tests on incoming commits. We also use Evergreen for running multiple classes of daily performance tests. In this project we are focused on our highest level tests, meant to represent actual end-user performance. We call these tests System Performance tests.
For _System Performance_tests, we use EC2 to deploy real and relatively beefy clusters of c3.8xlarge nodes for various MongoDB clusters: standalone servers, 3 Node Replica Sets, and Sharded Clusters. These are intended to be representative of how customers run MongoDB. Using EC2 allows us to flexibly and efficiently deploy such large clusters as needed. Each MongoDB node in the cluster is run on its own EC2 node, and the workload is driven from another EC2 node.
Repeatability
There's an aspect of performance testing that is not obvious and often ignored. Most benchmarking blogs and reports are focusing on the maximum performance of a system, or whether it is faster than some competitor system. For our CI testing purposes, we primarily care about repeatability of the benchmarks. This means, the same set of tests for the same version of MongoDB on the same hardware should produce the same results whether run today or in a few months. We want to be able to detect small changes in performance due to our ongoing development of MongoDB. A customer might not get very upset about a 5% change in performance, but they will get upset about multiple 5% regressions adding up to a 20% regression.
The easiest way to avoid the large regressions is to identify and address the small regressions promptly as they happen, and stop the regressions getting to releases or release candidates. We do want to stress MongoDB with a heavy load, but, achieving some kind of maximum performance is completely secondary to this test suite’s goal of detecting changes.
For some of our tests, repeatability wasn't looking so good. In the below graph, each dot represents a daily build (spoiler -- you’ll see this graph again):
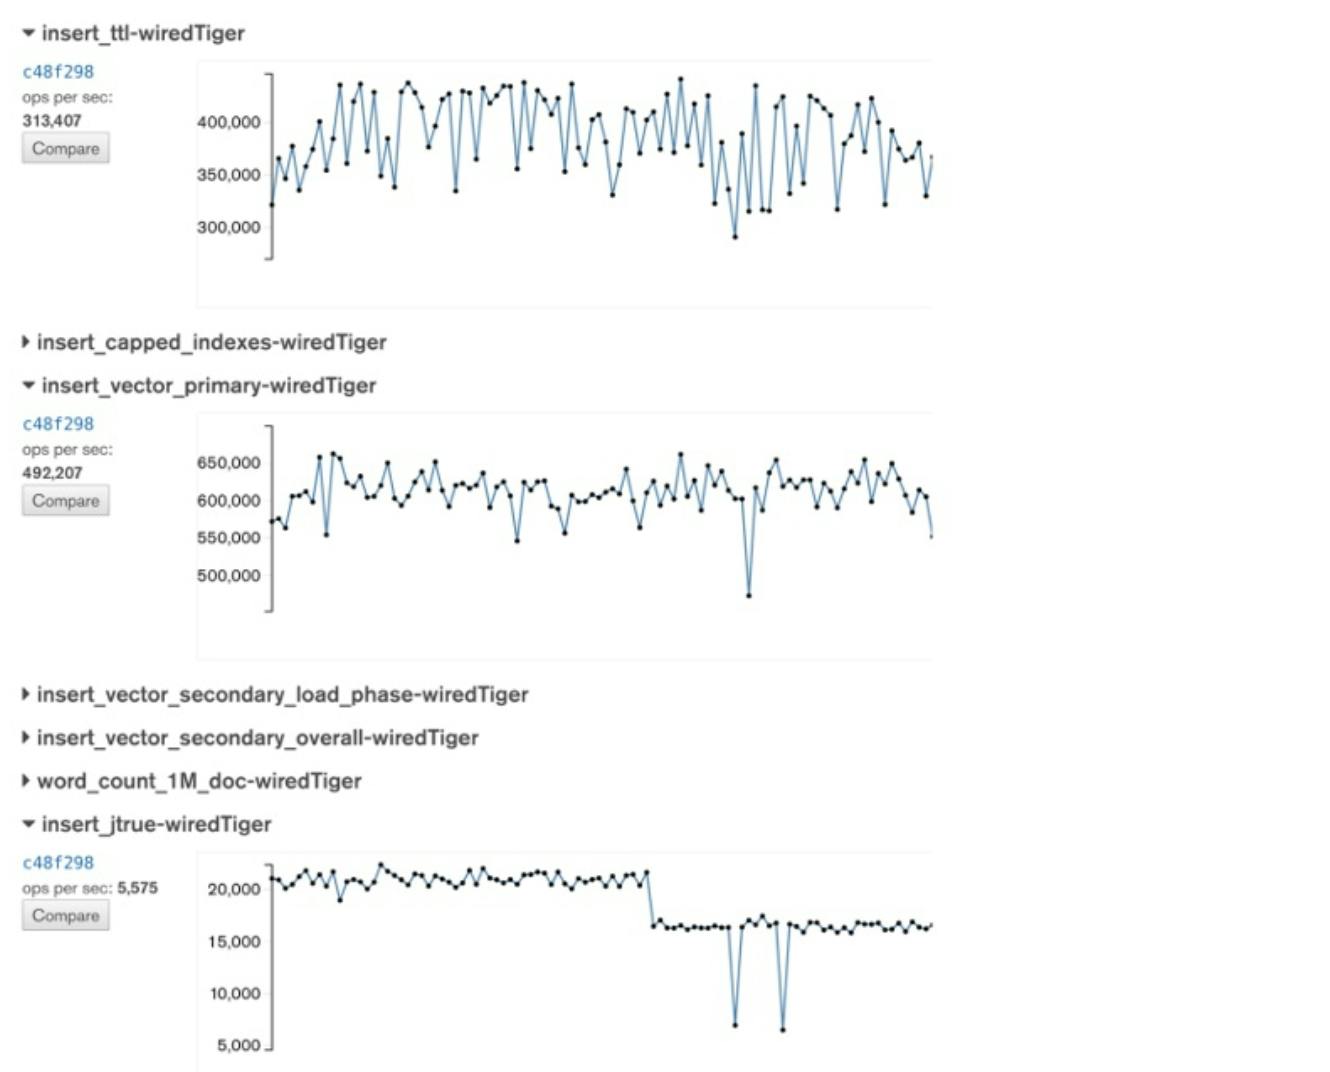
Eyeballing the range from highest to lowest result, the difference is over 100,000 documents / second from day to day. Or, as a percentage, a 20-30% range.
Investigation
To reduce such variation from our test configuration, we set out on a project to reduce any environmental noise. Instead of focusing on the difference between daily MongoDB builds, we ran tests to focus on EC2 itself.
Process: Test and Analyze
Benchmarking is really an exercise of the basic scientific process:
Try to understand a real world phenomenon, such as an application that uses MongoDB
Create a model (aka benchmark) of that phenomenon (this may include setting a goal, like "more updates/sec")
Measure
Analyze and learn from the results
Repeat: do you get the same result when running the benchmark / measuring again?
Change one variable (based on analysis) and repeat from above
We applied this benchmarking process to evaluate the noise in our system. Our tests produce metrics measuring the average operations per second (ops/sec). Occasionally, we also record other values but generally we use ops/sec as our result.
To limit other variables, we locked the mongod binary to a stable release (3.4.1) and repeated each test 5 times on 5 different EC2 clusters, thus producing 25 data points.
We used this system to run repeated experiments. We started with the existing system and considered our assumptions to create a list of potential tests that could help us determine what to do to decrease the variability in the system. As long as we weren’t happy with the results we returned to this list and picked the most promising feature to test. We created focused tests to isolate the specific feature, run the tests and analyze our findings. Any workable solutions we found were then put into production.
For each test, we analyzed the 25 data points, with a goal of finding a configuration that minimizes this single metric:
range = (max - min) / median
Being able to state your goal as a single variable such as above is very powerful. Our project now becomes a straightforward optimization process of trying different configurations, in order to arrive at the minimum value for this variable. It's also useful that the metric is a percentage, rather than an absolute value. In practice, we wanted to be able to run all our tests so that the range would always stay below 10%.
Note that the metric we chose to focus on is more ambitious than, for example, focusing on reducing variance. Variance would help minimize the spread of most test results, while being fairly forgiving about one or two outliers. For our use case, an outlier represents a false regression alert, so we wanted to find a solution without any outliers at all, if possible.
Any experiment of this form has a tension between the accuracy of the statistics, and the expense (time and money) of running the trials. We would have loved to collect many more trials per cluster, and more distinct clusters per experiment giving us higher confidence in our results and enabling more advanced statistics. However, we also work for a company that needed the business impact of this project (lower noise) as soon as possible. We felt that the 5 trials per cluster times 5 clusters per experiment gave us sufficient data fidelity with a reasonable cost.
Assume nothing. Measure everything.
The experimental framework described above can be summarized in the credo of: Assume nothing. Measure everything.
In the spirit of intellectual honesty, we admit that we have not always followed the credo of Assume nothing. Measure everything, usually to our detriment. We definitely did not follow it when we initially built the System Performance test suite. We needed the test suite up as soon as possible (preferably yesterday). Instead of testing everything, we made a best effort to stitch together a useful system based on intuition and previous experience, and put it into production. It’s not unreasonable to throw things together quickly in time of need (or as a prototype). However, when you (or we) do so, you should check if the end results are meeting your needs, and take the results with a large grain of salt until thoroughly verified. Our system gave us results. Sometimes those results pointed us at useful things, and other times they sent us off on wild goose chases.
Existing Assumptions
We made a lot of assumptions when getting the first version of the System Performance test suite up and running. We will look into each of these in more detail later, but here is the list of assumptions that were built into the first version of our System Performance environment:
Assumptions:
A dedicated instance means more stable performance
Placement groups minimize network latency & variance
Different availability zones have different hardware
For write heavy tests, noise predominantly comes from disk
Ephemeral (SSD) disks have least variance
Remote EBS disks have unreliable performance
There are good and bad EC2 instances
In addition, the following suggestions were proposed as solutions to reducing noise in the system:
Just use i2 instances (better SSD) and be done with it
Migrate everything to Google Cloud
Run on prem -- you’ll never get acceptable results in the cloud
Results
After weeks of diligently executing the scientific process of hypothesize - measure - analyze - repeat we found a configuration where the range of variation when repeating the same test was less than 5%. Most of the configuration changes were normal Linux and hardware configurations that would be needed on on-premise hardware just the same as on EC2. We thus proved one of the biggest hypotheses wrong:
You can't use cloud for performance testing
With our first experiment, we found that there was no correlation between test runs and the EC2 instances they were run on. Please note that these results could be based on our usage of the instance type; you should measure your own systems to figure out the best configuration for your own system. You can read more about the specific experiment and its analysis in our blog post EC2 instances are neither good nor bad.
There are good and bad EC2 instances
After running the first baseline tests, we decided to investigate IO performance. Using EC2, we found that by using Provisioned IOPS we get a very stable rate of disk I/O per second. To us, it was surprising that ephemeral (SSD) disks were essentially the worst choice. After switching our production configuration from ephemeral SSD to EBS disks, the variation of our test results decreased dramatically. You can read more about our specific findings and how different instance types performed in our dedicated blog post EBS instances are the stable option.
Ephemeral (SSD) disks have least variance
Remote EBS disks have unreliable performance -> PIOPS
Just use i2 instances (better SSD) and be done with it (True in theory)
Next, we turned our attention to CPU tuning. We learned that disabling CPU options does not only stabilize CPU-bound performance results. In fact, noise in IO-heavy tests also seems to go down significantly with CPU tuning.
For write heavy tests, noise predominantly comes from disk
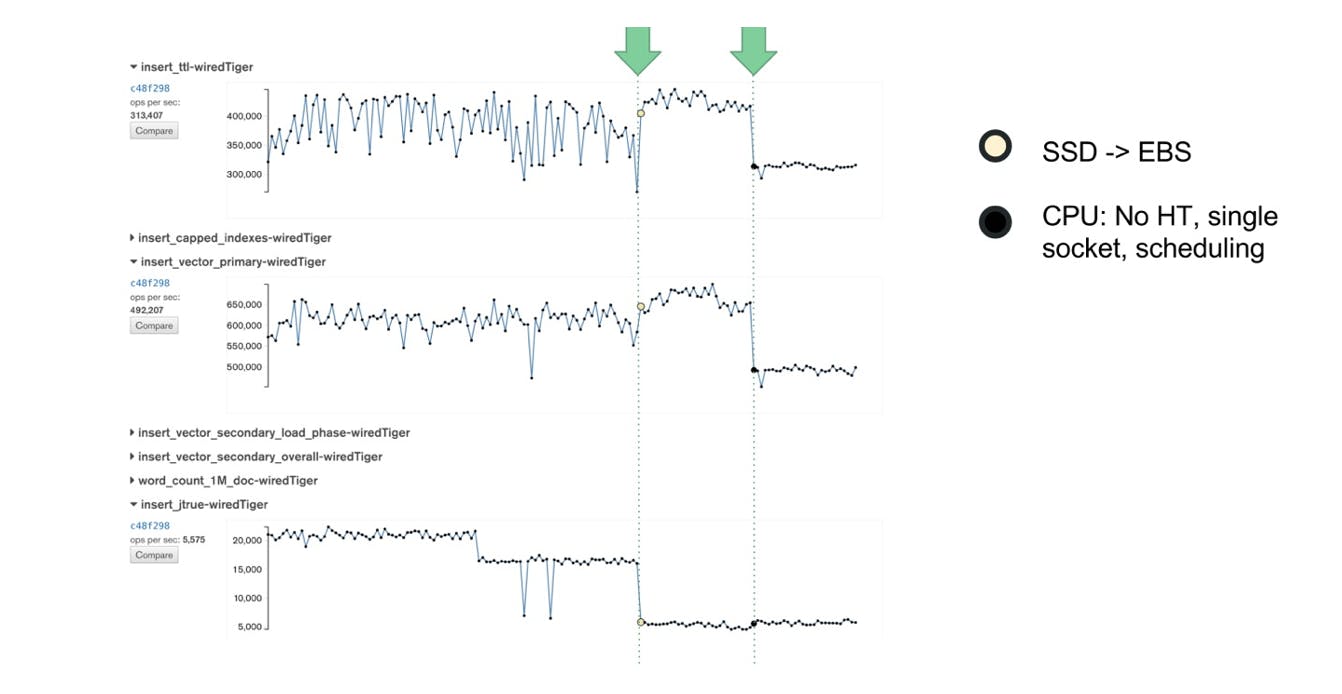
After we disabled CPU options, the variance in performance decreased again. In the below graph you can see how changing from SSD to EBS and disabling CPU options reduced the performance variability of our test suite. You can read more about the CPU options we tuned in our blog post Disable CPU options.
At the end of the project we hadn’t tested all of our original assumptions, but we had tested many of them. We still plan to test the remaining ones when time and priority allow:
A dedicated instance means more stable performance
Placement groups minimize network latency & variance
Different availability zones have different hardware
Through this process we also found that previously suggested solutions would not have solved our pains either:
Just use i2 instances (better SSD) and be done with it (True in theory)
Migrate everything to Google Cloud: Not tested!
Conclusion of the tests
In the end, there was still noise in the system, but we had reduced it sufficiently that our System Performance tests were now delivering real business value to the company. Every bit of noise bothers us, but at the end of the day we got to a level of repeatability in which test noise was no longer our most important performance related problem. As such, we stopped the all out effort on reducing system noise at this point.
Adding in safeguards
Before we fully moved on to other projects, we wanted to make sure to put up some safeguards for the future. We invested a lot of effort into reducing the noise, and we didn’t want to discover some day in the future that things had changed and our system was noisy again. Just like we want to detect changes in the performance of MongoDB software, we also want to detect changes in the reliability of our test platform.
As part of our experiments, we built several canary benchmarks which give us insights into EC2 performance itself based on non-MongoDB performance tests. We decided to keep these tests and run them as part of every Evergreen task, together with the actual MongoDB benchmark that the task is running. If a MongoDB benchmark shows a regression, we can check whether a similar regression can be seen in any of the canary benchmarks. If yes, then we can just rerun the task and check again. If not, it's probably an actual MongoDB regression.
If the canary benchmarks do show a performance drop, it is possible that the vendor may have deployed upgrades or configuration changes. Of course in the public cloud this can happen at arbitrary times, and possibly without the customers ever knowing. In our experience such changes are infrequently the cause for performance changes, but running a suite of "canary tests" gives us visibility into the day to day performance of the EC2 system components themselves, and thus increases confidence in our benchmark results.
The canary tests give us an indication of whether we can trust a given set of test results, and enables us to clean up our data. Most importantly, we no longer need to debate whether it is possible to run performance benchmarks in a public cloud because we measure EC2 itself!
Looking forward
This work was completed over 1.5 years ago. Since that time it has provided the foundation that all our subsequent and future work has been built upon. It has led to 3 major trends:
We use the results. Because we lowered the noise enough, we are able to regularly detect performance changes, diagnose them, and address them promptly. Additionally, developers are also "patch testing" their changes against System Performance now. That is, they are using System Performance to test the performance of their changes before they commit them, and address any performance changes before committing their code. Not only have we avoided regressions entering into our stable releases, in these cases we’ve avoided performance regressions ever making it into the code base (master branch).
We’ve added more tests. Since we find our performance tests more useful, we naturally want more such tests and we have been adding more to our system. In addition to our core performance team, the core database developers also have been steadily adding more tests. As our system became more reliable and therefore more useful, the motivation to create tests across the entire organization has increased. We now have the entire organization contributing to the performance coverage.
We’ve been able to extend the system. Given the value the company gets from the system, we’ve invested in extending the system. This includes adding more automation, new workload tools, and more logic for detecting when performance changes. None of that would have been feasible or worthwhile without lowering the noise of the System Performance tests to a reasonable level. We look forward to sharing more about these extensions in the future.
Coda: Spectre/Meltdown
As we came back from the 2018 New Years holidays, just like everyone else we got to read the news about the Meltdown and Spectre security vulnerabilities. Then, on January 4, all of our tests went red! Did someone make a bad commit into MongoDB, or is it possible that Amazon had deployed a security update with a performance impact? I turned out that one of our canary tests - the one sensitive to cpu and networking overhead - had caught the 30% drop too! Later, on Jan 13, performance recovered. Did Amazon undo the fixes? We believe so, but have not heard it confirmed.
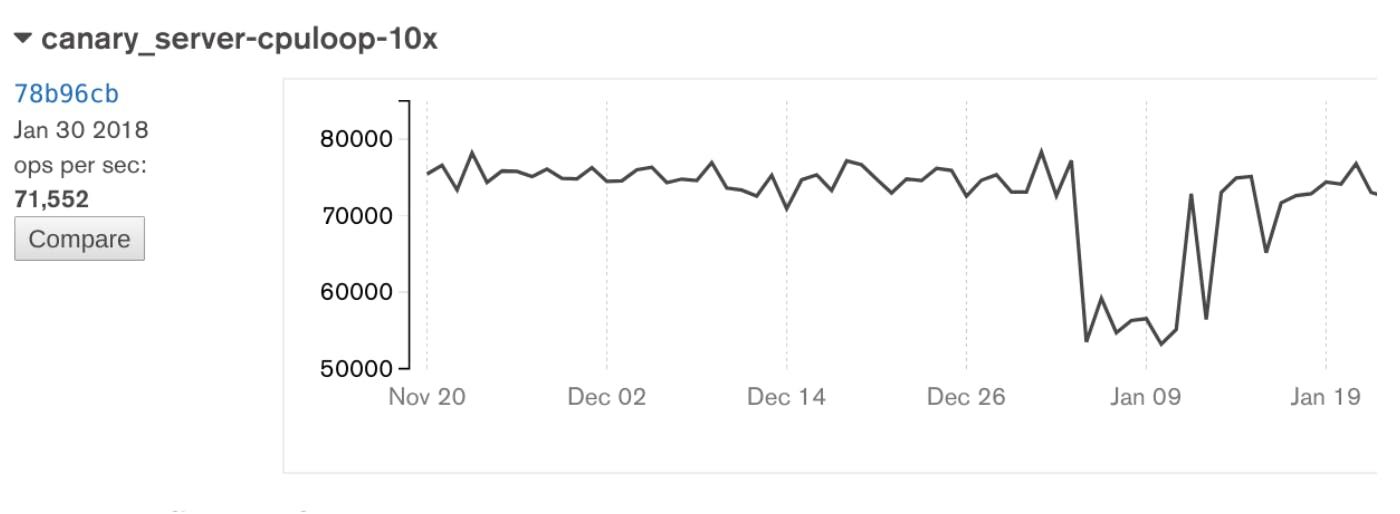
The single spike just before Jan 13 is a rerun of an old commit. This confirms the conclusion that the change in performance comes from the system, as running a Jan 11 build of MongoDB after Jan 13, will result in higher performance. Therefore the results depend on the date the test was run, rather than which commit was tested.
As the world was scrambling to assess the performance implications of the necessary fixes, we could just sit back and watch them in our graphs. Getting on top of EC2 performance variations has truly paid off.
Update: @msw pointed us to this security bulletin, confirming that indeed one of the Intel microcode updates were reverted on January 13.