Docs Home → View & Analyze Data → MongoDB Compass
View Query Performance
On this page
To help you better understand the performance of your query, you can view your query's explain plan.
About This Task
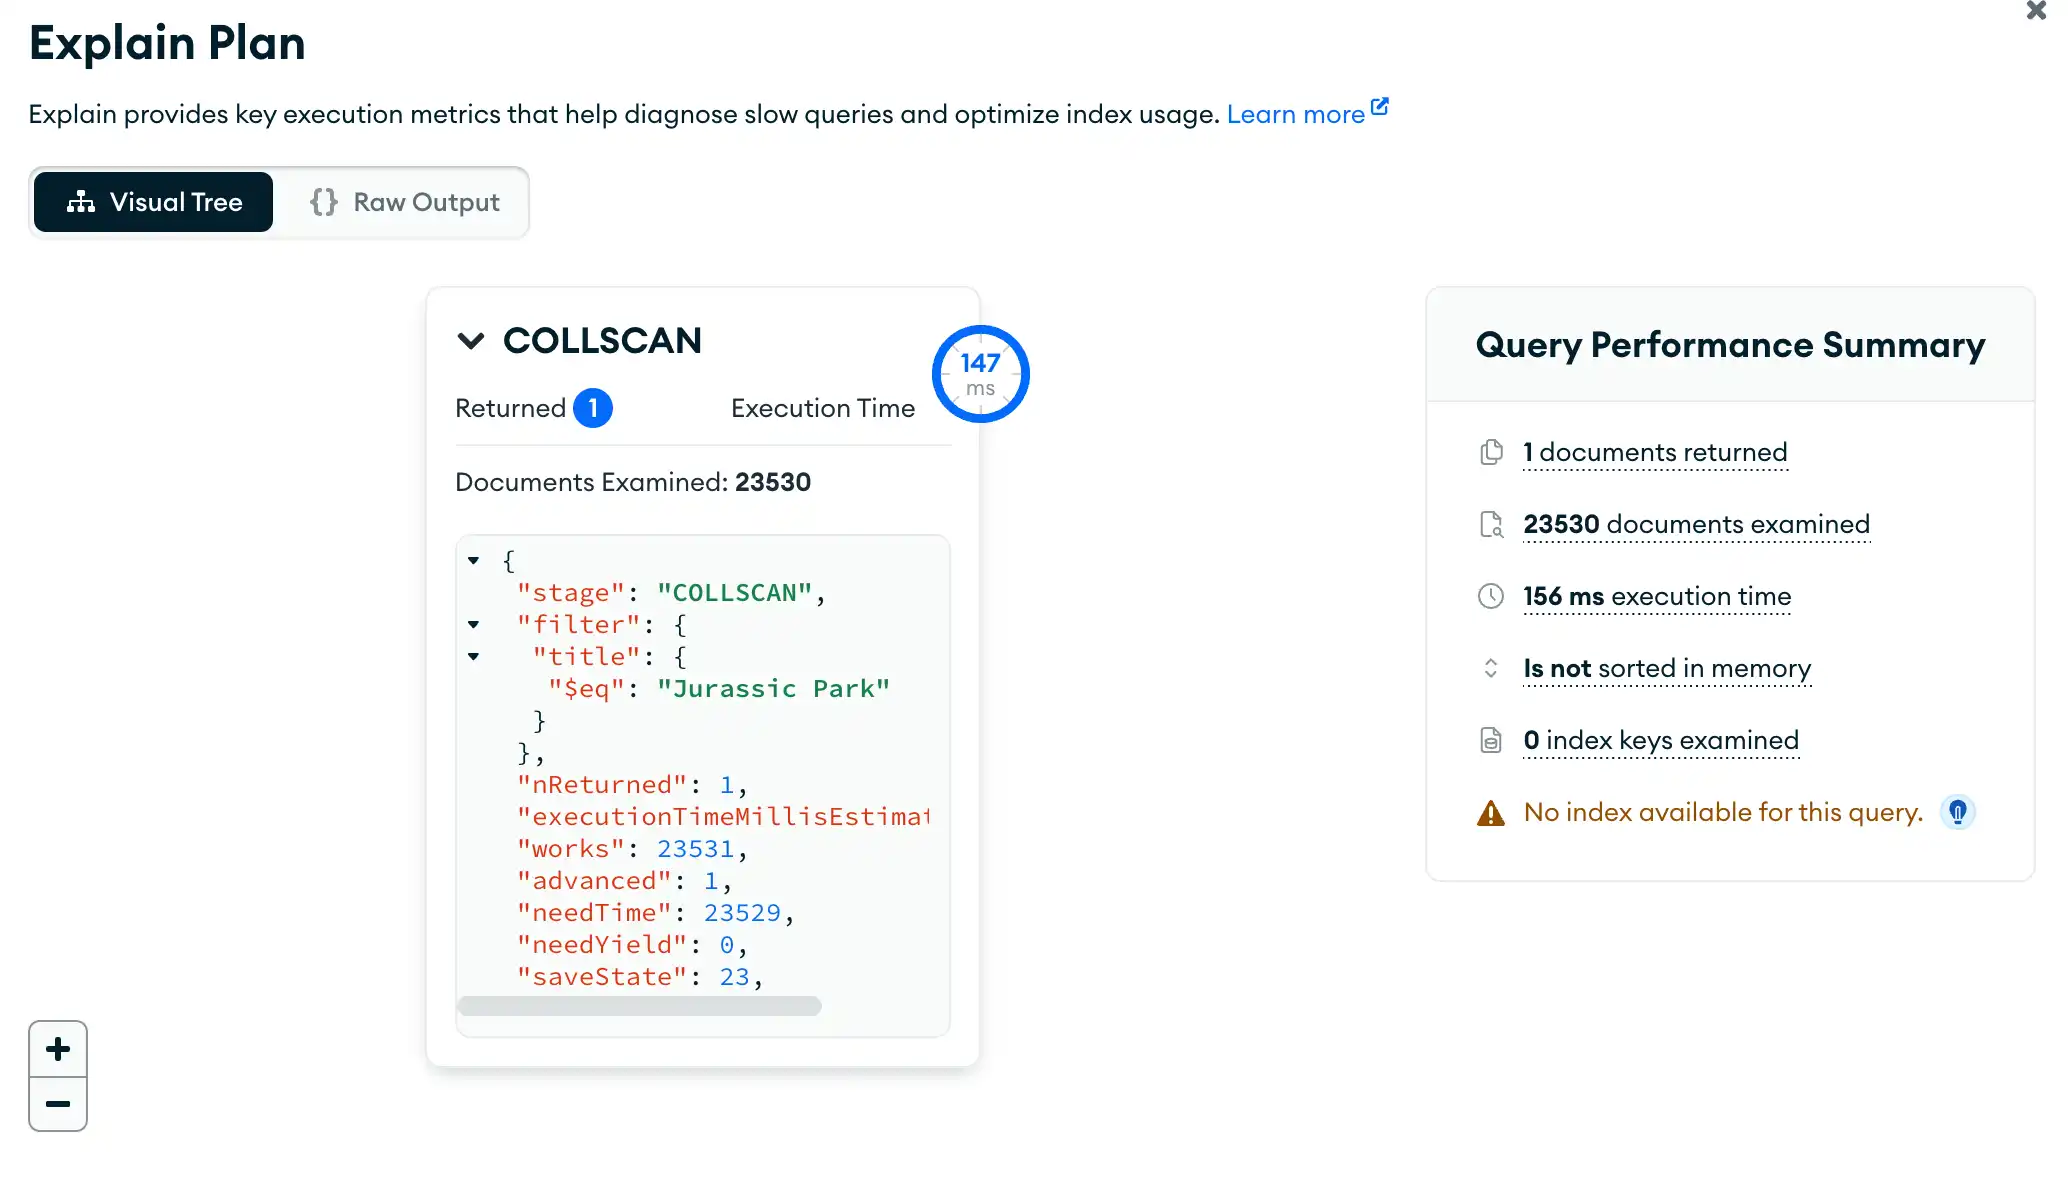
On the Explain Plan modal, you can view the explain stages as a Visual Tree, where each query operation appears as a node on the tree. You can also view the explain details in raw JSON format by selecting the Raw Output view.
Note
The explain plan includes a Query Performance Summary with information on the execution of your query such as:
Execution time
The number of returned documents
The number of examined documents
The number of examined index keys
Note
The Explain Plan is not available if you are connected to Data Lake.
Steps
Click the Explain button
In the query bar, click the Explain button to open the modal.


Select a query operation
By default, the explain stages are are shown as a Visual Tree. Each query operation appears as a node on the tree.
For more detailed execution information about the query operation, click the corresponding node.
For example, the following explain plan provides detailed information on
a query that filters for { title : "Jurassic Park" }:

(Optional) Select the Raw Output view.
To view your full explain plan as raw JSON, select the Raw Output view.