Currency Analysis with Time Series Collections #3 — MACD and RSI Calculation


Rate this article


In the first post of this series, we learned how to group currency data based on given time intervals to generate candlestick charts. In the second article, we learned how to calculate simple moving average and exponential moving average on the currencies based on a given time window. Now, in this post we’ll learn how to calculate more complex technical indicators.
As shown in the below diagram, MACD indicator has three main components: MACD Line, MACD Signal, and Histogram. (The blue line represents MACD Line, the red line represents MACD Signal, and green and red bars represent histogram):
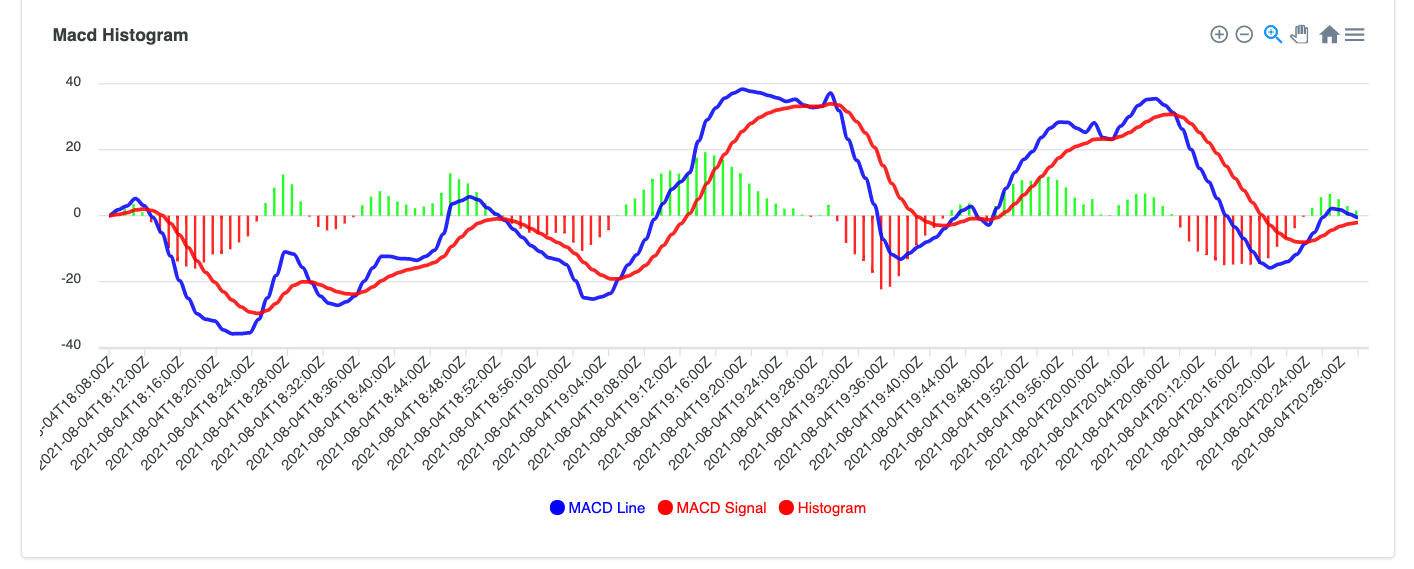
- MACD Line is calculated by subtracting the 26-period (mostly, days are used for the period) exponential moving average from the 12-period exponential moving average.
- After we get the MACD Line, we can calculate the MACD Signal. MACD Signal is calculated by getting the nine-period exponential moving average of MACD Line.
- MACD Histogram is calculated by subtracting the MACD Signal from the MACD Line.
In the previous blog posts, we learned how we can group the second-level raw data into five-minutes intervals through the
$group stage and $dateTrunc operator:
After that, we need to calculate two exponential moving averages with different parameters:
After we calculate two separate exponential moving averages, we need to apply the
$subtract operation in the next stage of the aggregation pipeline:After we’ve obtained the
macdLine field, then we can apply another exponential moving average to this newly generated field (macdLine) to obtain MACD signal value:Therefore, we will have two more fields:
macdLine and macdSignal. We can generate another field as macdHistogram that is calculated by subtracting the macdSignal from macdLine value:Now we have three derived fields:
macdLine, macdSignal, and macdHistogram. Below, you can see how MACD is visualized together with Candlesticks: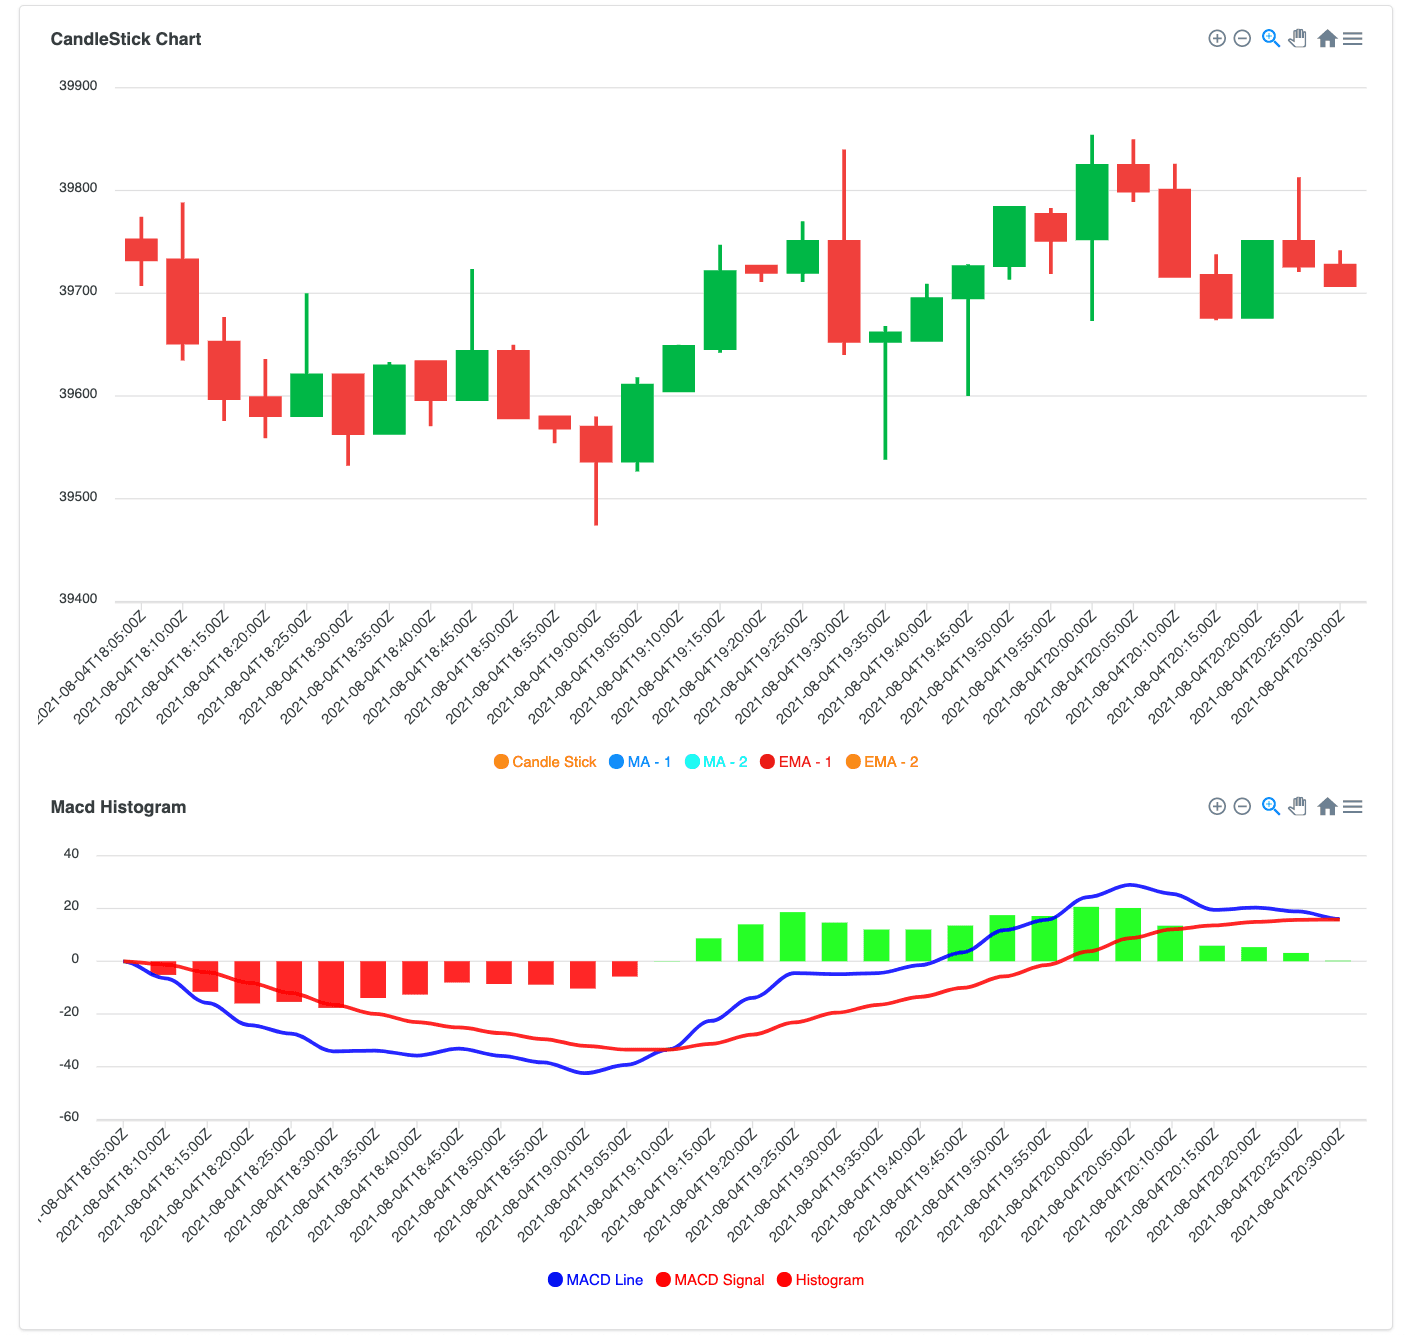
This is the complete aggregation pipeline:
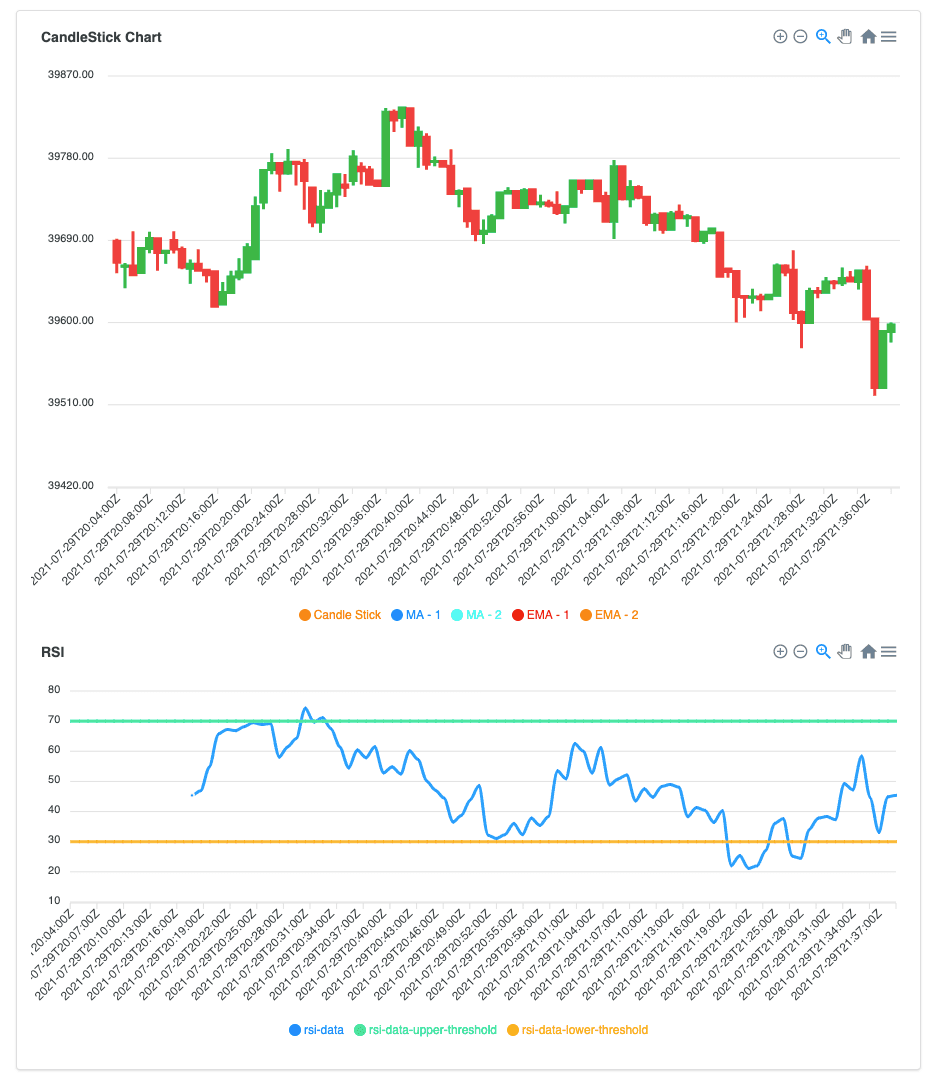
RSI (Relativity Strength Index) is another financial technical indicator that reveals whether the asset has been overbought or oversold. It usually uses a 14-period time frame window, and the value of RSI is measured on a scale of 0 to 100. If the value is closer to 100, then it indicates that the asset has been overbought within this time period. And if the value is closer to 0, then it indicates that the asset has been oversold within this time period. Mostly, 70 and 30 are used for upper and lower thresholds.
Calculation of RSI is a bit more complicated than MACD:
- For every data point, the gain and the loss values are set by comparing one previous data point.
- After we set gain and loss values for every data point, then we can get a moving average of both gain and loss for a 14-period. (You don’t have to apply a 14-period. Whatever works for you, you can set accordingly.)
- After we get the average gain and the average loss value, we can divide average gain by average loss.
- After that, we can smooth the value to normalize it between 0 and 100.
Firstly, we need to define the gain and the loss value for each interval.
The gain and loss value are calculated by subtracting one previous price information from the current price information:
- If the difference is positive, it means there is a price increase and the value of the gain will be the difference between current price and previous price. The value of the loss will be 0.
- If the difference is negative, it means there is a price decline and the value of the loss will be the difference between previous price and current price. The value of the gain will be 0.
Consider the following input data set:
Once we calculate the Gain and Loss, we will have the following data:
But in the MongoDB Aggregation Pipeline, how can we refer to the previous document from the current document? How can we derive the new field (
$previousPrice) from the previous document in the sorted window?MongoDB 5.0 introduced the
$shift operator that includes data from another document in the same partition at the given location, e.g., you can refer to the document that is three documents before the current document or two documents after the current document in the sorted window.We set our window with partitioning and introduce new field as previousPrice:
$shift takes two parameters:byspecifies the location of the document which we’ll include. Since we want to include the previous document, then we set it to-1. If we wanted to include one next document, then we would set it to1.outputspecifies the field of the document that we want to include in the current document.
After we set the
$previousPrice information for the current document, then we need to subtract the previous value from current value. We will have another derived field “diff” that represents the difference value between current value and previous value:We’ve set the
diff value and now we will set two more fields, gain and loss, to use in the further stages. We just apply the gain/loss logic here:After we have enriched the symbol data with gain and loss information for every document, then we can apply further partitioning to get the moving average of gain and loss fields by considering the previous 14 data points:
Here we also used another newly introduced operator,
$documentNumber. While we do calculations over the window, we give a sequential number for each document, because we will filter out the documents that have the document number less than or equal to 14. (RSI is calculated after at least 14 data points have been arrived.) We will do filtering out in the later stages. Here, we only set the number of the document.After we calculate the average gain and average loss for every symbol, then we will find the relative strength value. That is calculated by dividing average gain value by average loss value. Since we apply the divide operation, then we need to anticipate the “divide by 0” problem as well:
Relative strength value has been calculated and now it’s time to smooth the Relative Strength value to normalize the data between 0 and 100:
We basically set
null to the first 14 documents. And for the others, RSI value has been set.Below, you can see a one-minute interval candlestick chart and RSI chart. After 14 data points, RSI starts to be calculated. For every interval, we calculated the RSI through aggregation queries by processing the previous data of that symbol:
This is the complete aggregation pipeline:
MongoDB Aggregation Framework provides a great toolset to transform any shape of data into a desired format. As you see in the examples, we use a wide variety of aggregation pipeline stages and operators. As we discussed in the previous blog posts, time-series collections and window functions are great tools to process time-based data over a window.
In this post we've looked at the $shift and $documentNumber operators that have been introduced with MongoDB 5.0. The
$shift operator includes another document in the same window into the current document to process positional data together with current data. In an RSI technical indicator calculation, it is commonly used to compare the current data point with the previous data points, and $shift makes it easier to refer to positional documents in a window. For example, price difference between current data point and previous data point.Another newly introduced operator is
$documentNumber. $documentNumber gives a sequential number for the sorted documents to be processed later in subsequent aggregation stages. In an RSI calculation, we need to skip calculating RSI value for the first 14 periods of data and $documentNumber helps us to identify and filter out these documents at later stages in the aggregation pipeline.Rate this article