Using the .NET BulkWriteAsync gets slower with each batch (have timings to proove)

Hi there,

I’m trying to UPDATE about 2.1 million rows in a mongodb collection in a .NET Core 3.1 console app. When I batch this into batches of 1000, I get TIMINGS of each call to BulkWriteAsync. Each call it gets slower and slower and slower. So I’ve done the following to try and eliminate possible reasons:

  • MongoDb sever is a docker image, on localhost (so there’s no outbound network latency)
  • Batch size is 1000 because when I check the BulkWriteResult, it reports that.
  • I’ve put timings around the full batch run and also just the BulkWriteAsync call
  • I’ve deleted all the indexes, in case they were hurting stuff
  • No other system is hitting the mongodb instance
  • I’m not running anything else on the machine. It runs under 20% CPU. It’s a new top end laptop from about 10 month ago (think: I/O / Ram / CPU)
  • The applications RAM is around the 100MB consistently. So there’s no obvious memory leak. And this is if i leave it for 30+ minutes even!
  • If i run a similar concept/query in the mongo shell, it’s -fast- and doesn’t get slower with each new batch.

Ok. so some code!

var bulkWriteOptions = new BulkWriteOptions
{
    BypassDocumentValidation = true,
    IsOrdered = false
};

using (var cursor = await collection.FindAsync(filterToGetAllDocuments, options))
{
    while (await cursor.MoveNextAsync())
    {
        stopwatch.Restart();

        batch++;

        Parallel.ForEach(cursor.Current, document =>
        {
            // This creates the list of UpdateOneModel<BsonDocument>, in parallel.
            cleanUpAction(document, documentsToUpdate);
        });

        // Now update all the documents in this BATCH.
        if (documentsToUpdate.Any())
        {
            bulkWriteAsyncStopwatch.Restart();
            var result = await collection.BulkWriteAsync(documentsToUpdate, bulkWriteOptions);
            bulkWriteAsyncStopwatch.Stop();
        }
    }
}

I’ve removed some boring stuff like logging or me recording the stopwatch timings to the console.out … but that’s the gist of it.

Finally, here are my timings:

| Total Time | BulkWriteAsync Time | Difference (time it took to generate the list of 1000 UpdateOneModel’s | – | — | — |
| 00:00.40 | 00:00.31 | 00:00.09 |
| 00:00.87 | 00:00.78 | 00:00.09 |
| 00:01.34 | 00:01.26 | 00:00.08 |
| 00:01.83 | 00:01.74 | 00:00.08 |
| 00:02.37 | 00:02.29 | 00:00.08 |
| 00:02.81 | 00:02.72 | 00:00.08 |
| 00:03.26 | 00:03.17 | 00:00.08 |
| 00:03.79 | 00:03.70 | 00:00.09 |
| 00:04.37 | 00:04.27 | 00:00.09 |

So we can see:

  • It’s about 8 or 9 ms to generate the list of 1000 UpdateOneModel’s (nice!)
  • First BulkWriteAsync is 31ms
  • Second BWA is just over double → 78ms
  • Next BWA is just under the previous double → 1s 26ms
  • Next BWA is just under the previous one by a half? so the slow-jump is lower (50% versus about 100%) - 1s 74ms

… and it keeps growing.

So this means each batch is taking longer and long to complete.

  • 78ms for batch 1
  • now another 1s 26ms for batch 2 (so total running time is now 0.78 + 1.26)
  • batch 3 = 1.74s (so total running time is now 0.78 + 1.26 + 1.74)
    … etc

I would have thought that each call to BWA would be -roughly- the same time? It -feels- like it’s doing all the previous batches and then this batch? I donno!

Here’s a screen shot of the BulkWriteResult for batch row #42 (which took 20.91 seconds to run)

So can someone PLEASE help? I just don’t know how to figure this one out?

I feel like this is an issue with the .NET driver?

1 Like

As a “seedling”, I couldn’t figure out how to edit my previous post. (I also tried reading the Readme.1st for help, prior).

Anyways, here’s the missing image from the opening post:

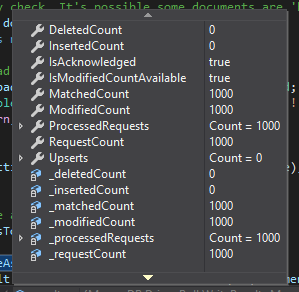
Here’s a screen shot of the BWR for batch row #42

image

Hello,
Did you find any solutions?