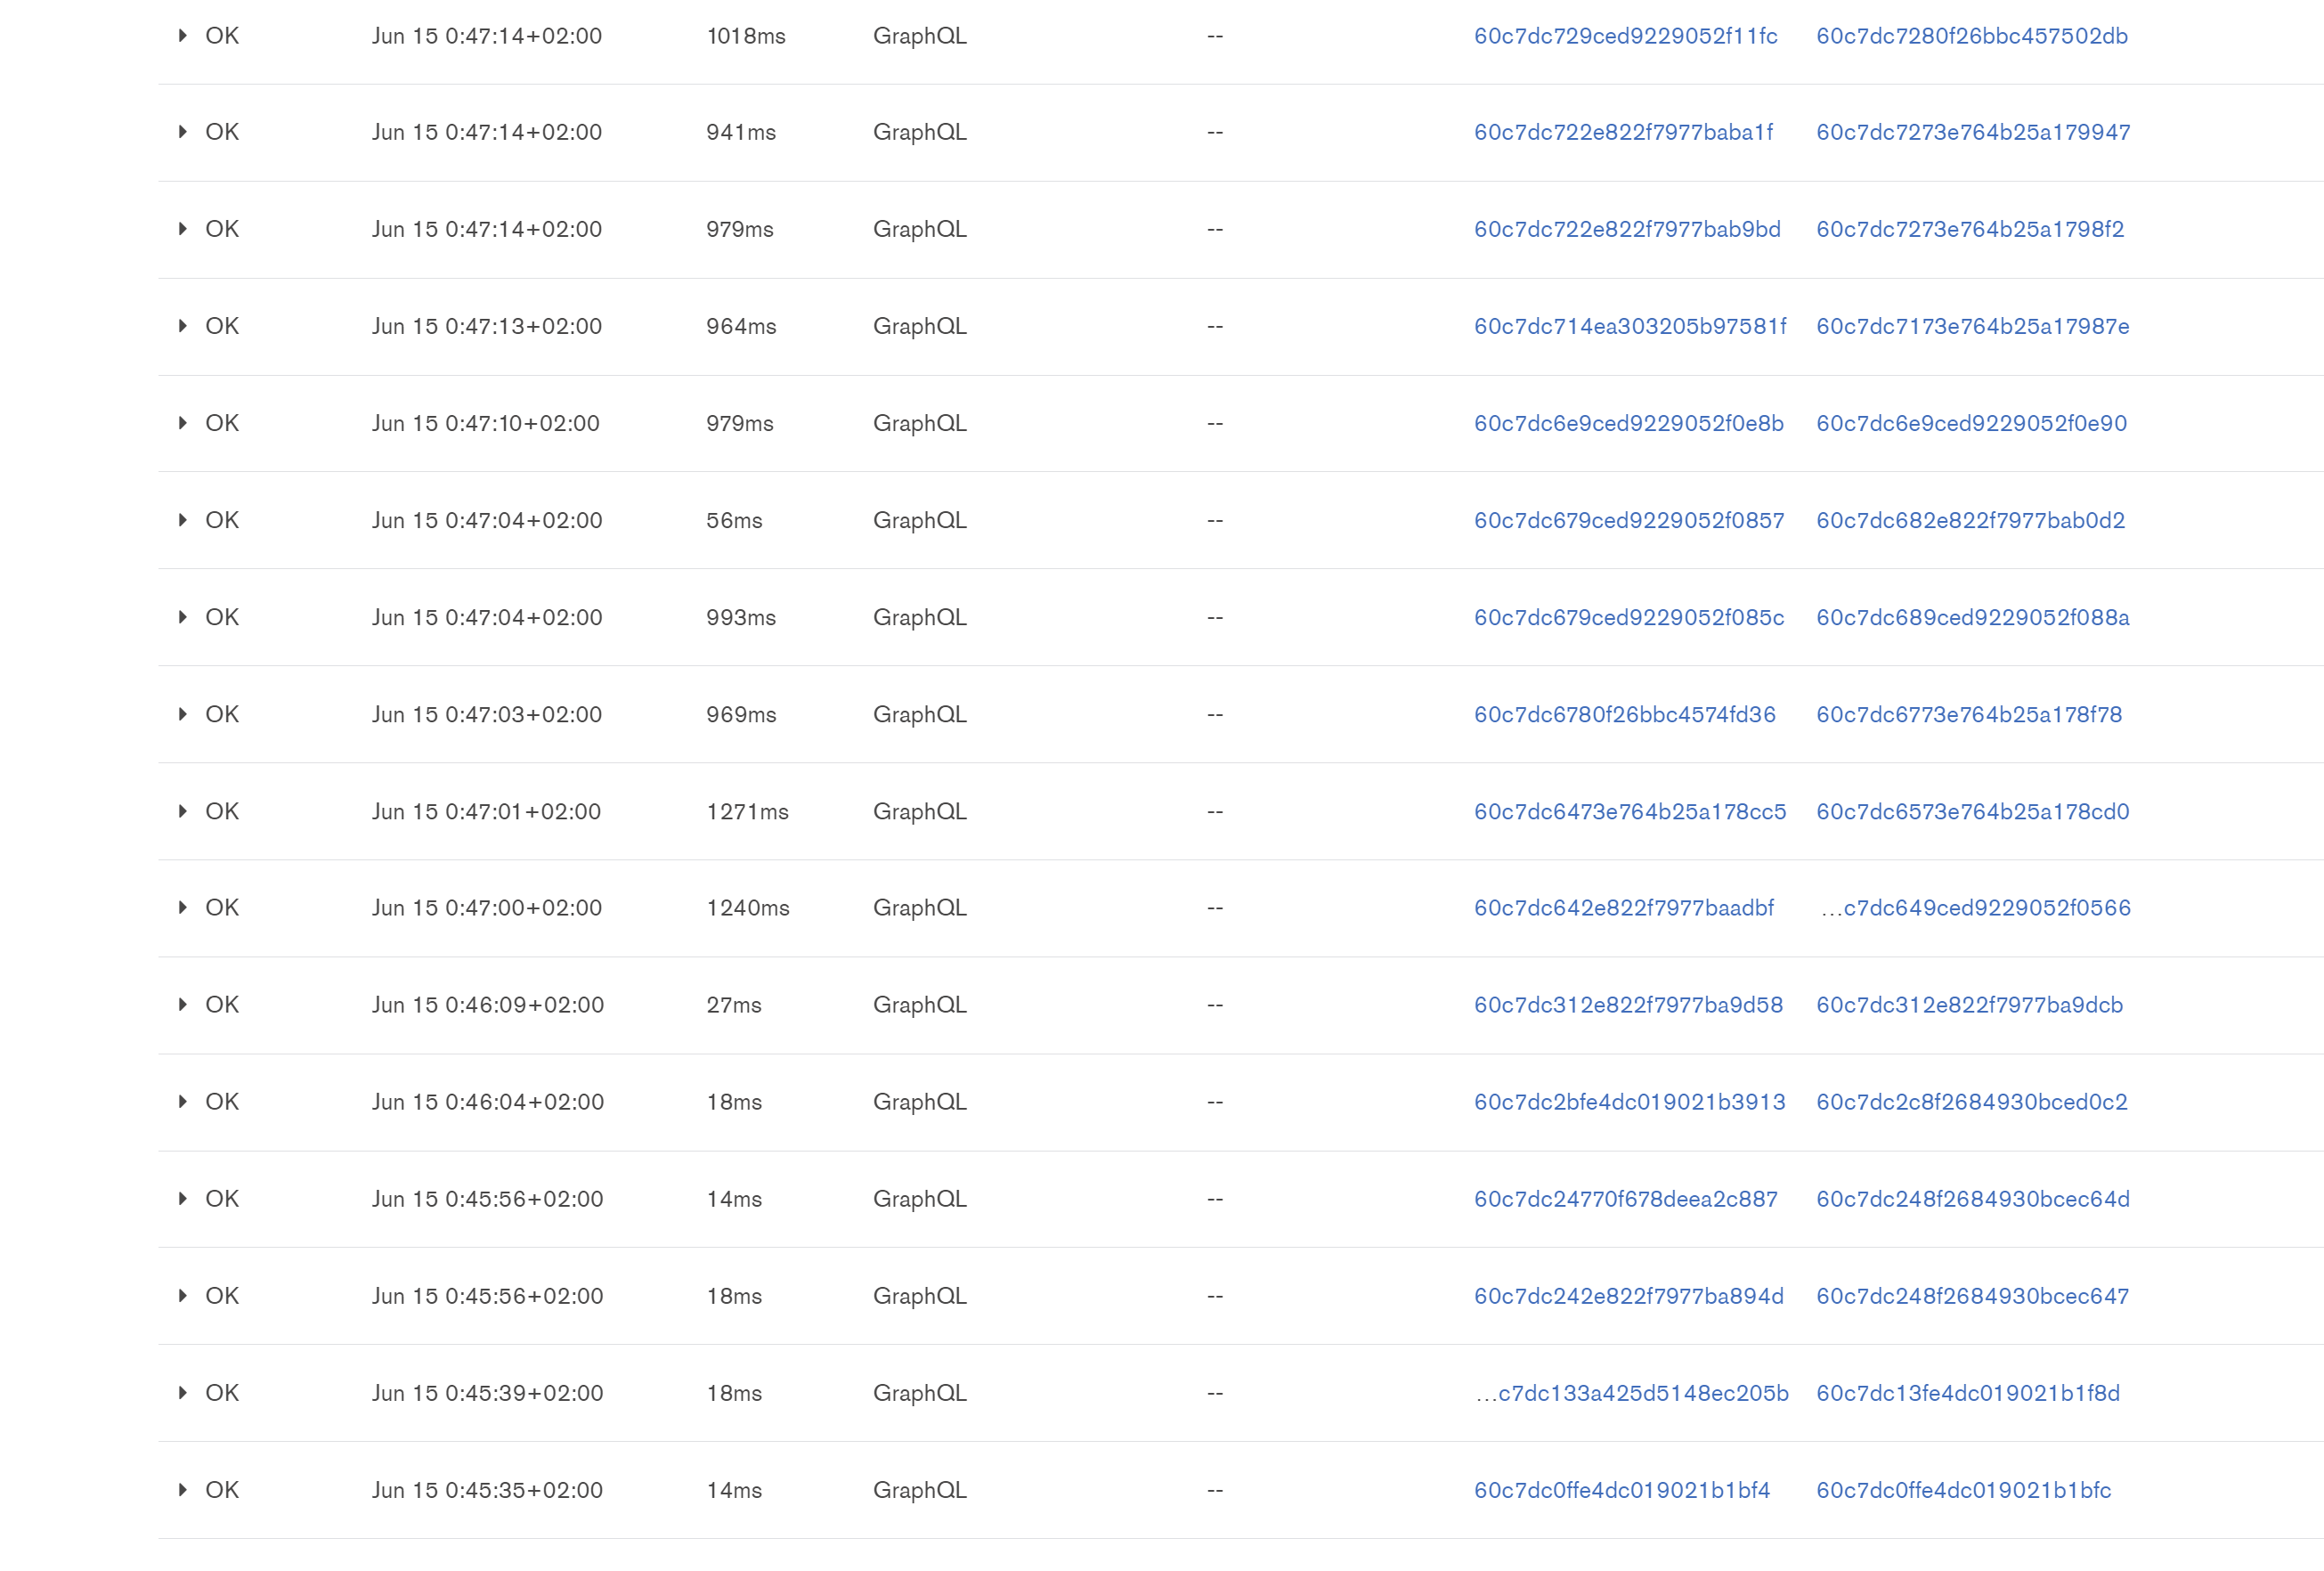
From “Jun 15 0:46:09+02:00” we noticed a drastic increase in the response time for each graphql query.
We haven’t done any change as we know, the time is also in the middle of the night for us in Sweden so not likely that we done any configuration changes.
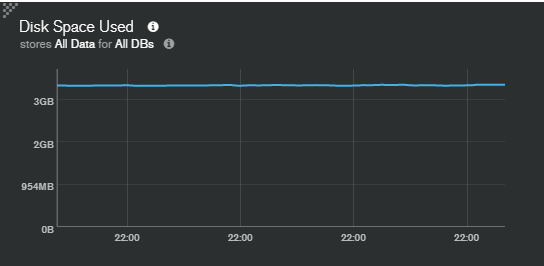
Looks like the data is stable.
6/13/2021 - 6/17/2021
And I can’t see anything wierd in the Atlas metrics.
We have had similar problems a couple of months ago, but they got resolved but MongoDB. So it feels reasonable that it is Realm problems and not our setup.
If the query at the bottom is a “findOne” operation that returns a single document using the {_id: 1} index and the top one is returning 1 million documents for a total of 5MB with a massive range query on date field without an index, I wouldn’t be too much surprised that it takes 1240ms to do so.
So:
How much data are these queries returning to the client?
Are these queries using efficient indexes to retrieve the data they are returning or able to reach quickly the documents they want to update, replace or delete (also indexes).
Adding a new one here: How far is your client from your Realm App and how far is your Realm App from your MongoDB Atlas cluster? Looks like the entire trip takes 14ms total minimum so it’s really well setup apparently on that regard. But if you deployed a global Realm App, maybe the query is processed in another region which can add a significant latency in the query.
Usually I deploy all my stuff in Ireland so both the Atlas cluster and the Realm App are really close to optimize the latency. But if you deployed a global Realm App, a query could be processed in US-west and this would need more time.
Sorry, misunderstood the question a bit. I meant that we didn’t have any increase in the amount of data, so shouldn’t be so much more that was returned from the queries.
But there is now difference in the amount of data returning direct from the queries etiher what i can see.
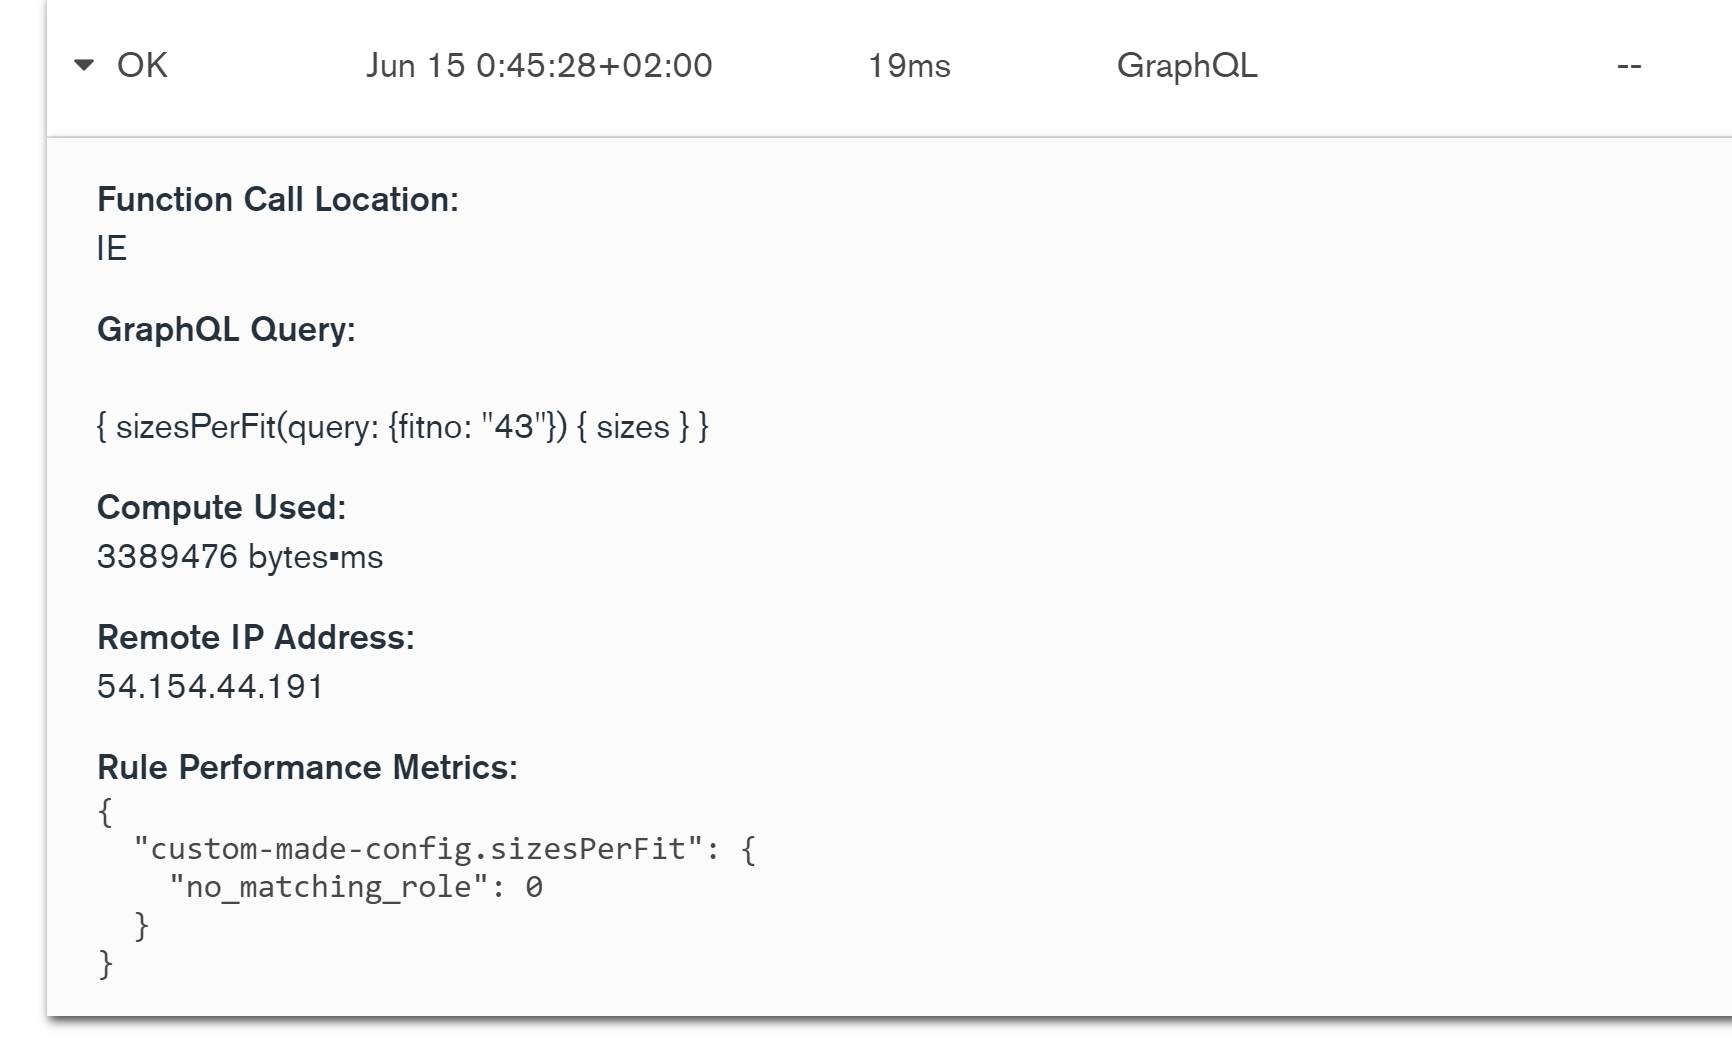
Here is a good example when the endpoint just started to be slow.
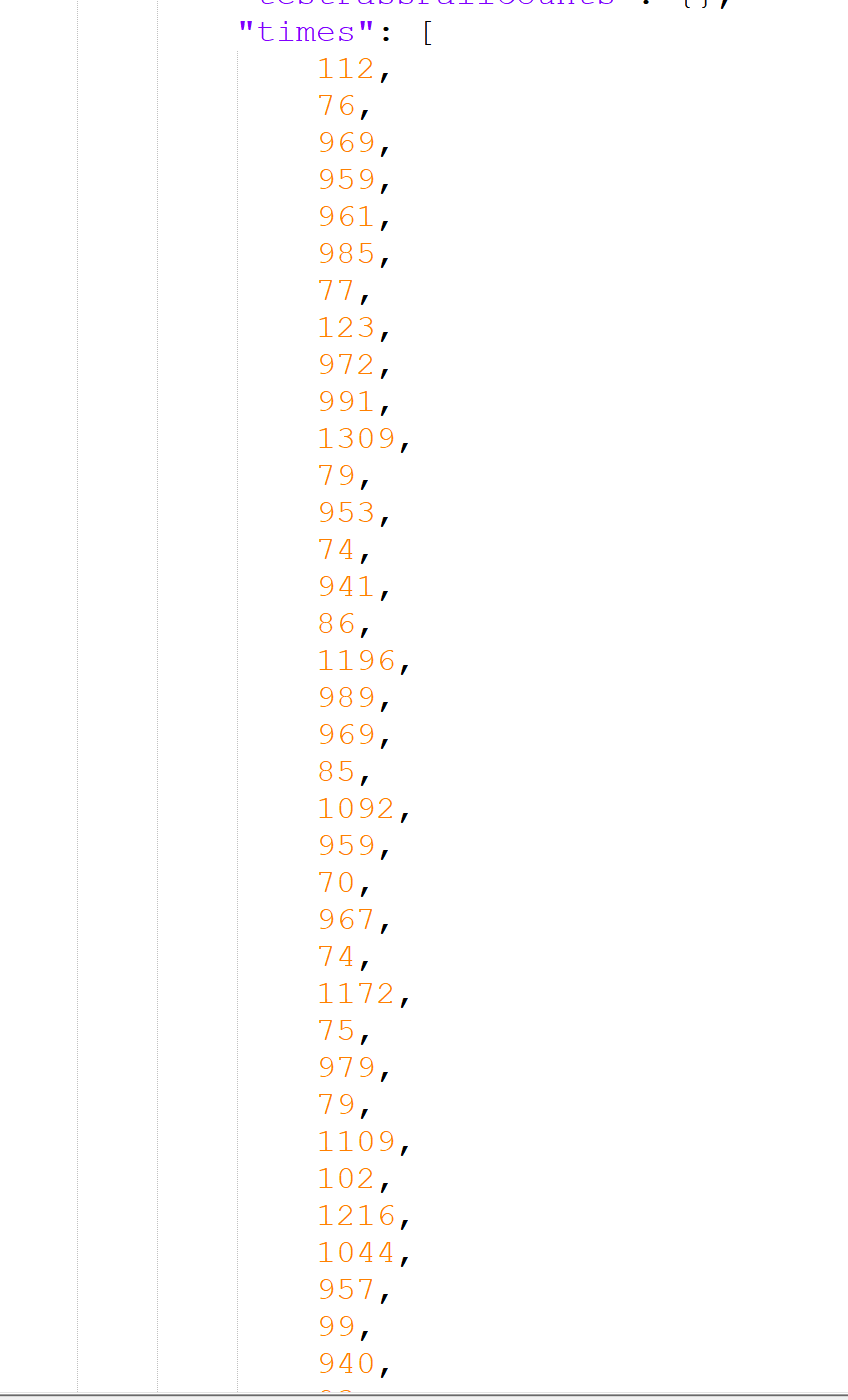
It’s a lot more clear if you can go through the whole logs. When i look at the graphql requests until “Jun 14 23:59:56+02:00” not a single one is over 100 ms. And then 1h after that not a single request is under 900ms.
We have some indexes, but that shouldn’t matter because we haven’t changed anything regarding that in this time period.
The “compute used” looks a lot larger on the 1018 ms query. I’m wondering why that is.
But I guess that explains the difference between the 2. Maybe there is a limit used in the first query and not in the second?
I just had some feedback from the team.
Can you redeploy your Realm app? Like add a dummy value then remove it or something like that.
They resolved a caching issue in the GraphQL schema this week and maybe this is what is causing this issue.
I did a new deploy now and after that i did a test in postman, i ran 100 calls with this query and got even more weird response times. Now they where either ~1000ms or ~80ms.
The team is still working on this problem. They might have solved at least a part of the problem.
Can you please try to redeploy the application once again with the UI and retry your queries and see if you notice any improvements or not?
We cache the GraphQL schemas whenever there is a deployment to an app but we missed an edge case somewhere where an app can be modified without deploying, such as logging in with an anonymous user. If you make a change to an app that requires a deployment (i.e. adding a dummy function) and deploy the app, the schemas should be cached again and requests should be faster if no new users/changes are added to the app after deployment. We are working on a small long-term fix to resolve this issue
 !
!