Realm notification subscription dispose

Hello

Our App is an IOT Xamarin.Forms app that by design relies on notification mechanism to keep the client UI updated in real time.

To do so, we heavily rely on Realm subscription callbacks; the way we have implemented it

is the following one:

  • we have a singleton pattern which returns a unique realm instance that is used in the whole application.

  • on that instance we subscribe for multiple notification events, so when a change occurs we are able to update the UI accordingly.

  • at the end of its use every subscription is correctly disposed

Callback signature is the following one:

void Callback(IRealmCollection sender, ChangeSet error, Exception changes)

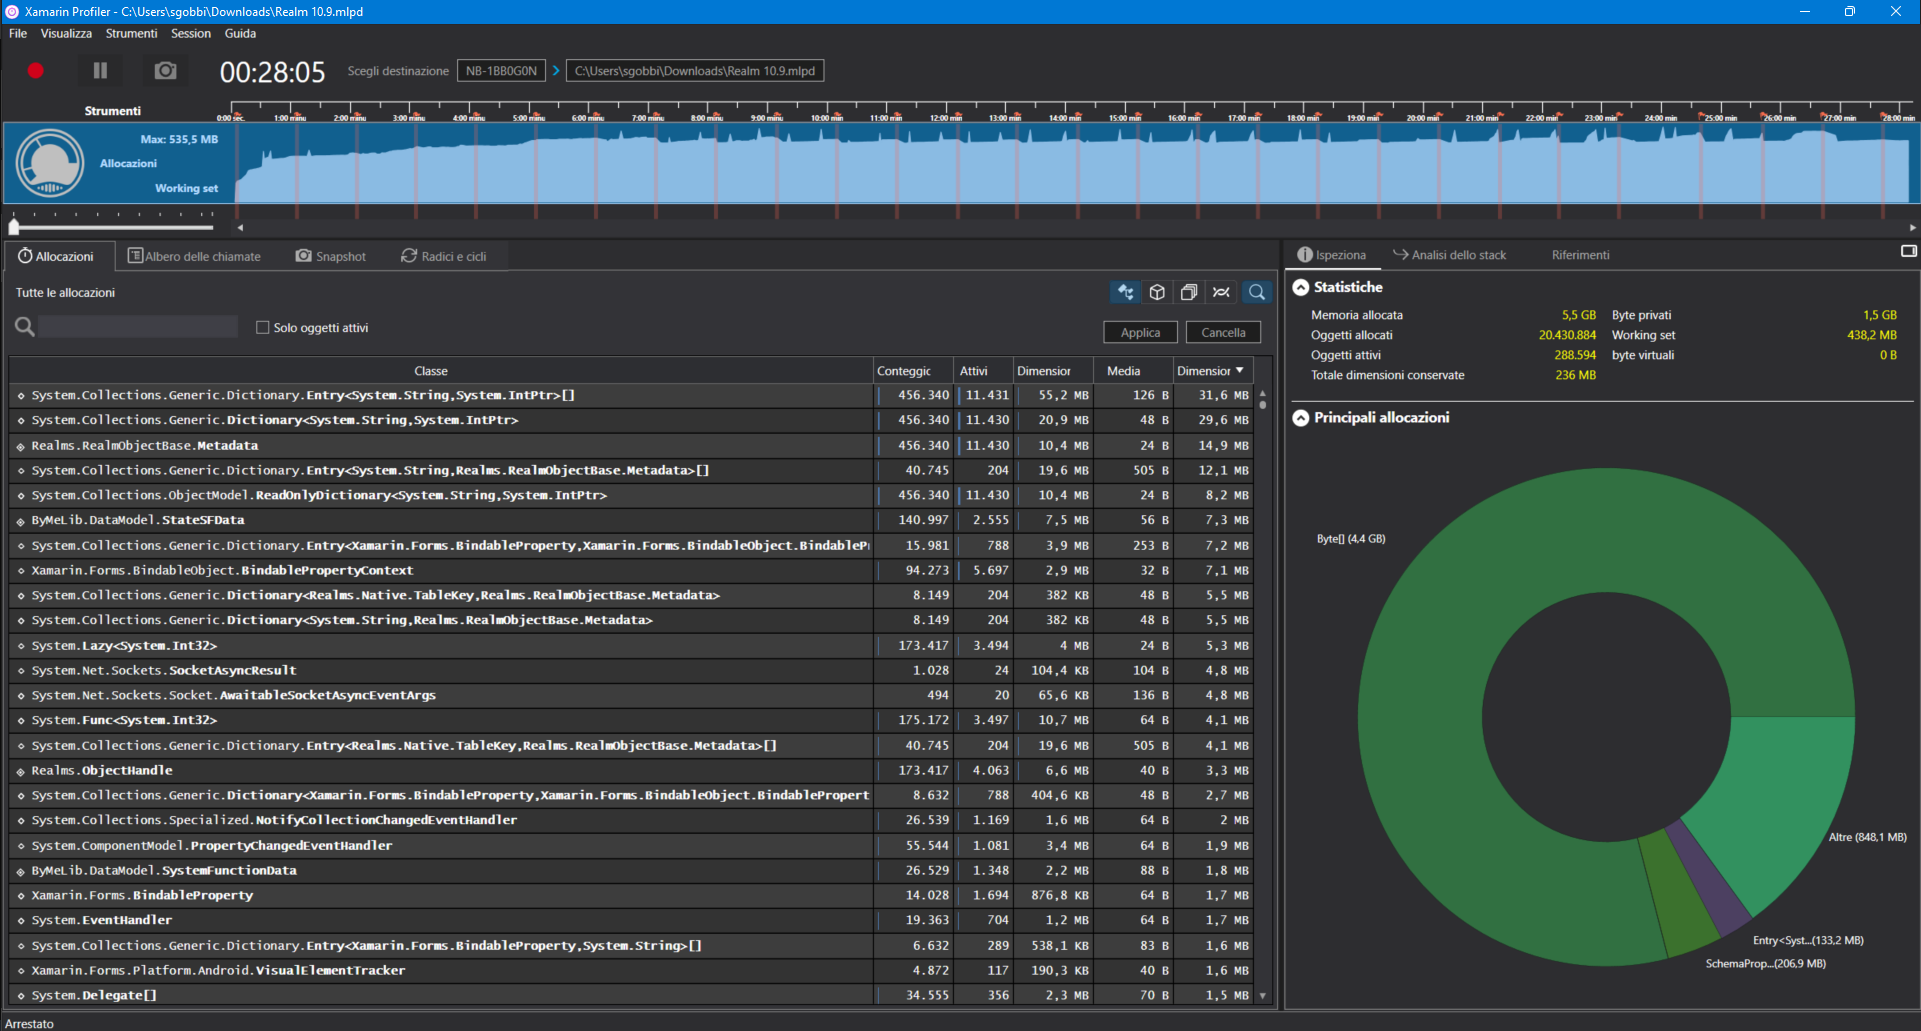
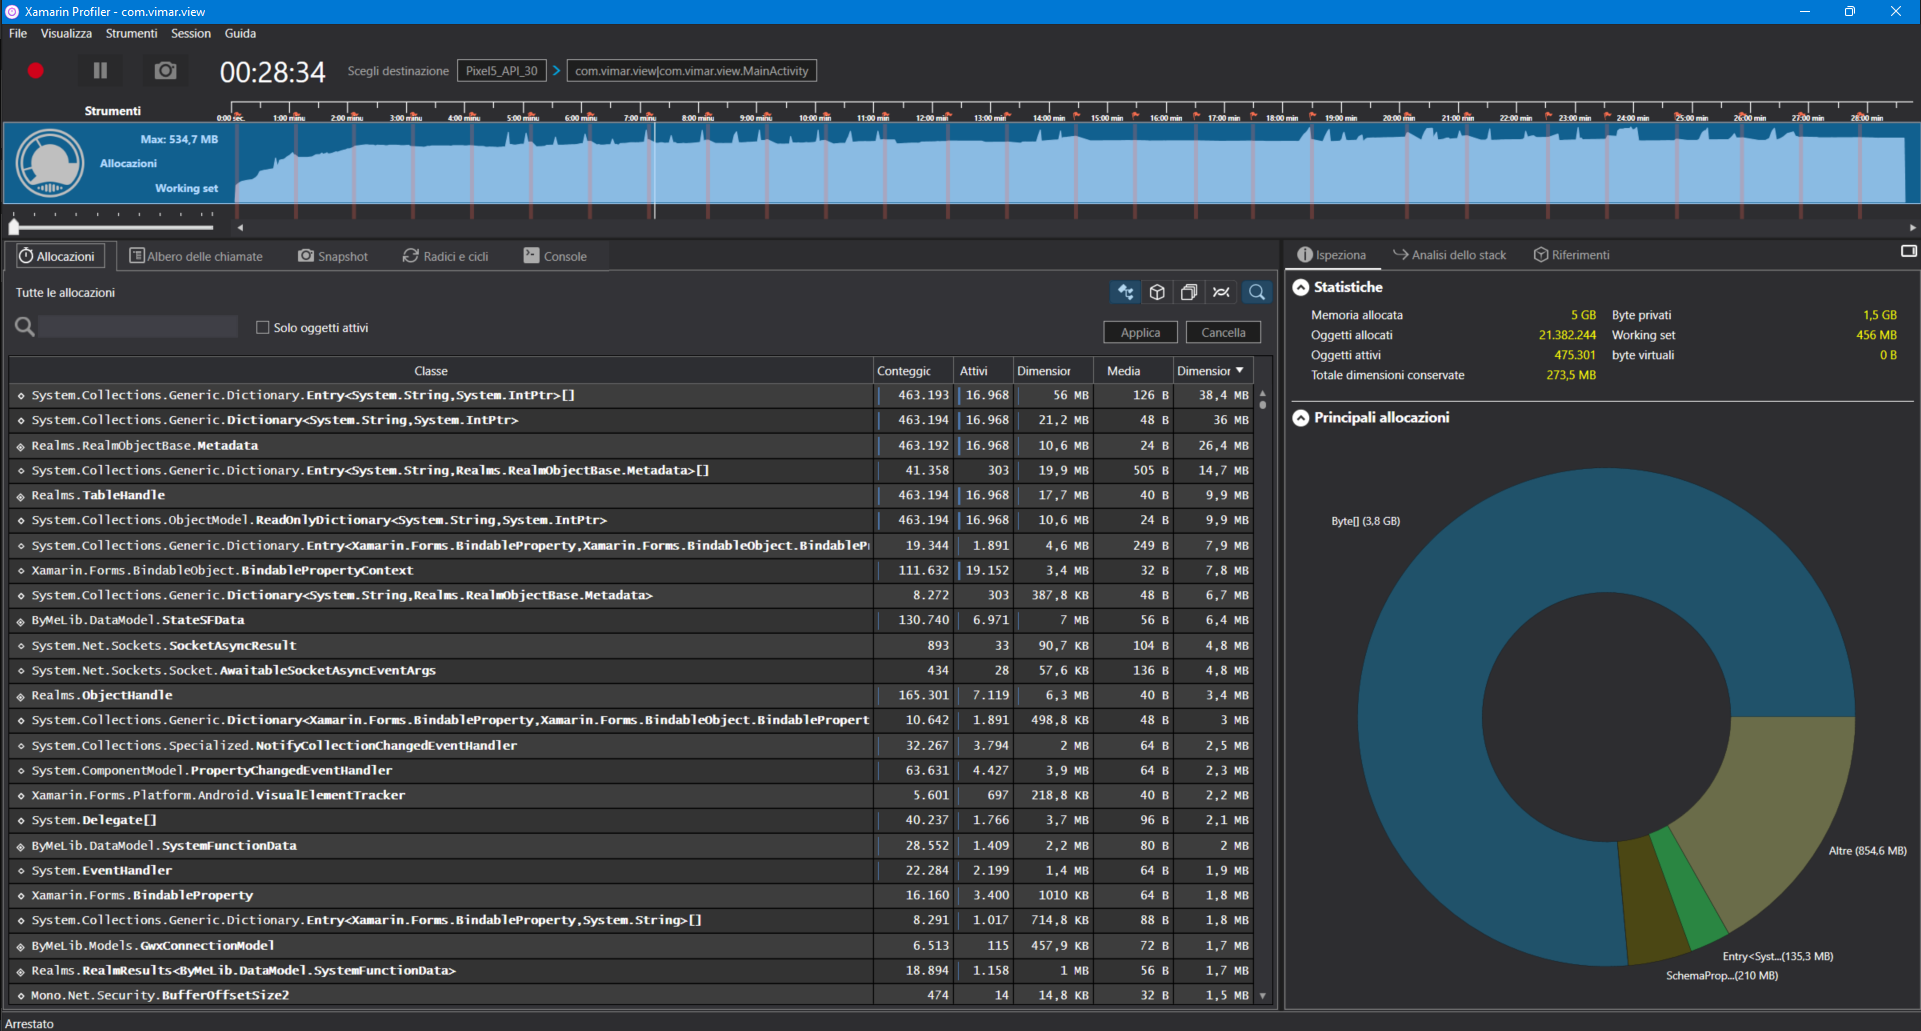
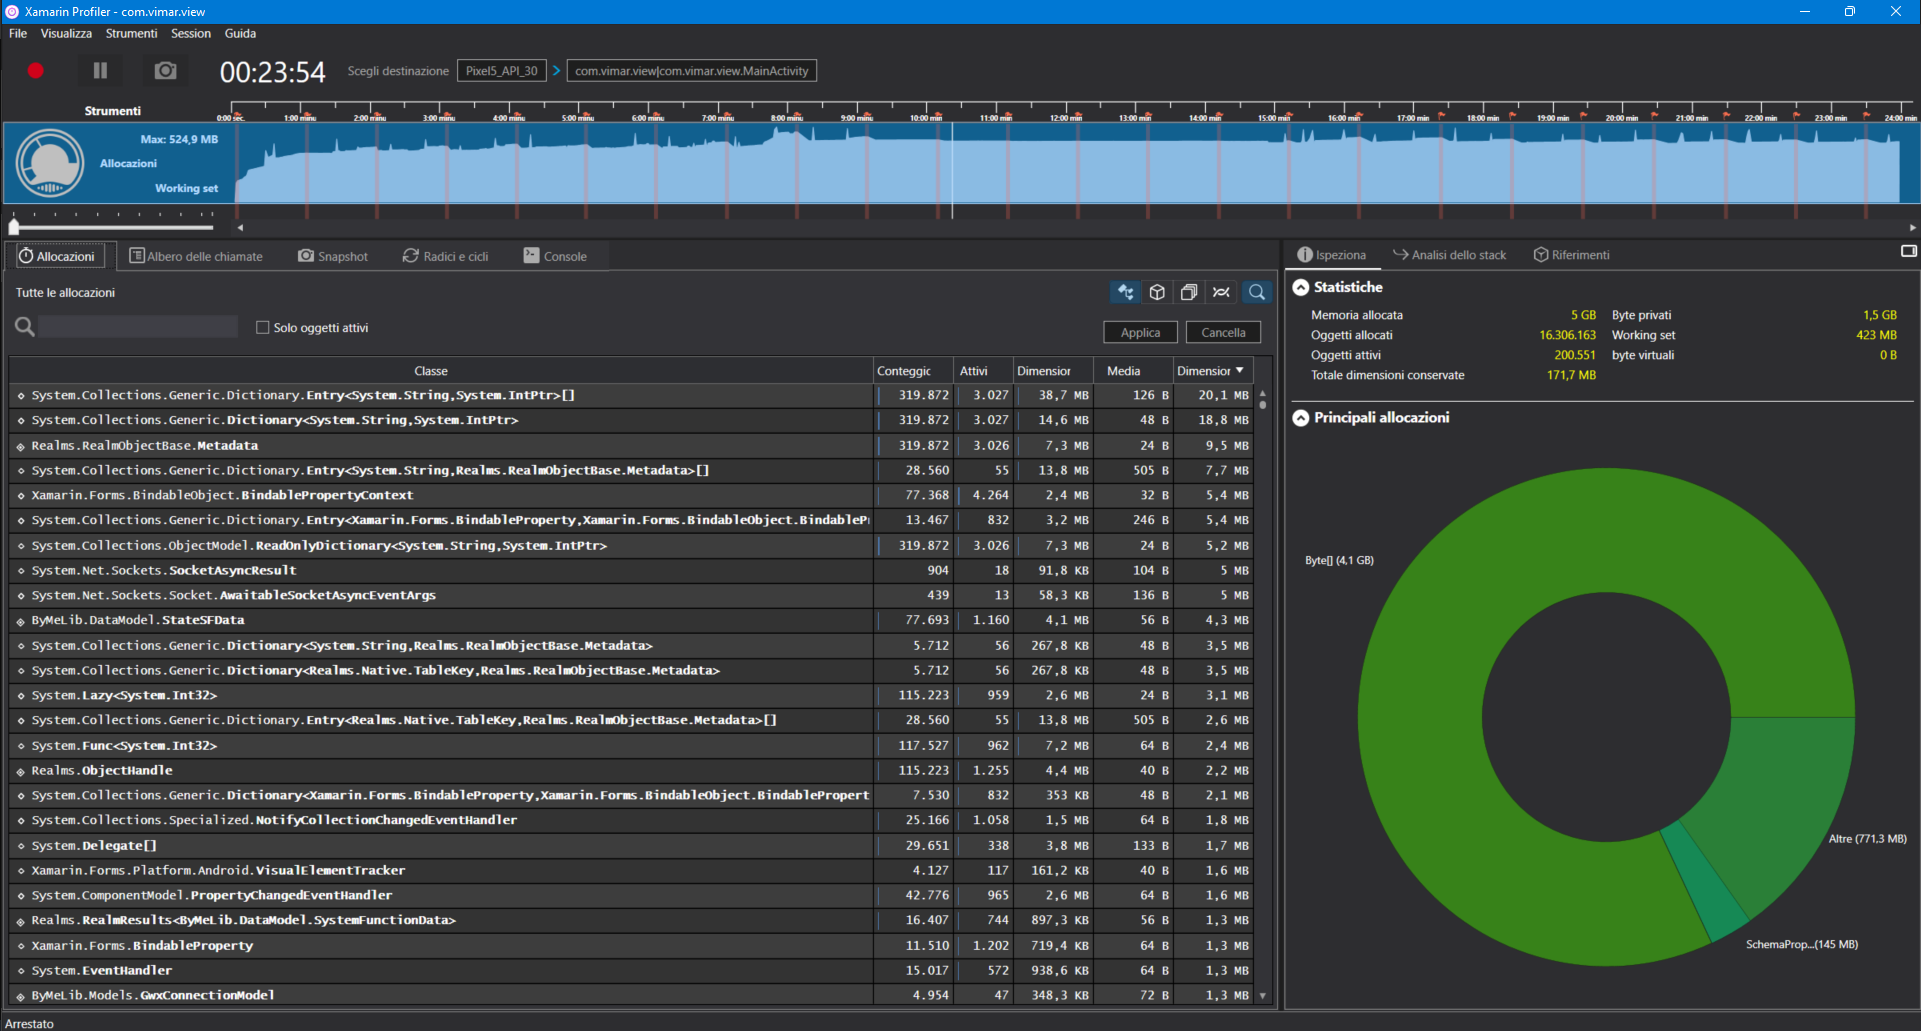
Recently we have been reported by our clients some memory leaks; to better assess the issue we have been using Xamarin Profiler,

a dedicated tool that allows an in depth memory usage analysis; after some tests, we determined that the collection of RealmObject instances

that are returned by the query we have used when we subcribed (that is passed to each subscription event as “sender” parameter)

seem not to be correctly released to be then processed by the following Garbage collector cycle, although “sender” should go out of scope as soon the subscription event ends.

If we disposed the realm instance inside our singleton class, everything seems working fine and the objects are correctly disposed;

unfortunately this approach can’t work for us, as our App as said above, needs only one realm instance in order to have a seamless notification process.

Can you please provide a feedback about this issue or have you ever been reported a similar situation?

Best regards.

2 Likes

Hey Allessandro, I’m sorry to hear you’re seeing memory leaks and would like to dive deeper into your observations. You’re saying that the sender in the callback is not getting garbage collected after the callback, but that is expected. It’s an instance of the original collection that created the subscription and should be collected once you dispose the subscription token and the collection variable goes out of scope. For example, if you have the following code:

class MyViewModel
{
    private IDisposable _notificationToken;

    public MyViewModel()
    {
        // Here the query collection is created
        var query = RealmSingleton.Realm.All<Foo>();
        
        _notificationToken = query.SubscribeForNotifications((sender, changes, error) =>
        {
            // Here sender is the same instance as query that is kept alive
            // by _notificationToken.
        });

        // Here query is eligible for collection, but won't be collected
        // because _notificationToken keeps a reference to it.
    }

    public void StopListening()
    {
        _notificationToken.Dispose();

        // Now that we've disposed the notification token, query
        // is eligible for collection and should be collected whenever
        // the GC decides to collect whatever generation it is in.
    }
}

I’d be interested in seeing the profile trace you collected - how many instances of RealmObject/RealmCollectionBase are you seeing? Are those growing unbounded or do they stay fairly constant throughout the lifetime of your app?

1 Like


Hello thanks for the quick feedback. As you can see from the highlighted area in the attached image (taken from Xamarin Profiler), the memory is progressivly increasing because of the supposed leak.

We are correctly unsubscribe all the tokens when we dispose each class that subscribes them; but some of these classes are alive for the whole app life-cycle and as a result the memory is not released when GC enters into action.

My best regards

1 Like

What version of the SDK are you using? That TableHandle type was removed from the SDK a long time ago? Can you perhaps update to the latest version and see if the issue still reproduces?

2 Likes

Hi Nikola,
I’m Alessandro’s collegue and I’m working with him at this memory leak issue.

Our app is using version 10.1.0, but we already did a test with the latest version (10.9.0) but nothing has changed.

My question is: the removal of the TableHandle type was due to some kind of similar issues or was just a code refactoring not related to the memory management?

I got a question about collection of objects generated by the notification subscription query.

As soon as the callback notify us, the collection and its objects are always referred to its original query reference or are those new instances created by a new query on the DB?

Stefano

1 Like

I did a test and the result says that the sender is the same, instead the first item in the collection has a different reference.

private RealmObject prevObj = null;
private IRealmCollection<RealmObject> prevSender = null;

private void Callback(IRealmCollection<RealmObject> sender, ChangeSet changes, Exception error)
{
	if (prevObj == null)
	{
		prevSender = sender;
		prevObj = sender.FirstOrDefault();
	}
	else
	{
		// This reference is equal
		if (object.ReferenceEquals(prevSender, sender))
		{	
			
		}
		
		var currObj = sender.FirstOrDefault();
		// This reference IS NOT equal
		if (object.ReferenceEquals(prevObj, currObj))
		{
		}
	}
}

Does this mean that a new instance is created, but the old one is disposed correctly?
Thank you

2 Likes

Hi Stefano,

  1. Removing TableHandle is unrelated to any memory leaks, it was just a simplification of existing code. It would be interesting to capture a profiler trace with 10.9.0 though as that will help us understand what are the objects that are being allocated and not collected.
  2. Your observation is correct - sender will be always the same instance of the collection you subscribed for notifications on. And yes, every time you access an element in that collection, a new instance of the object will be created, but assuming you don’t hold on to them somehow, they should be eligible for collection and should not leak. We do have tests confirming this, but it’s totally possible we’re not capturing your exact scenario. Judging from your original trace, RealmObject allocations should not be an issue as they’ve never referenced table handles - it must be a collection/query that is getting allocated and retained, not objects and I’m hoping that an up-to-date trace will point us in the right direction.
3 Likes

Hi Nikola,
thank you for your reply.

As you requested, I did a new test with version 10.9 and this is the result:

2 Likes

Hi Nikola,
I’m Alessandro’s and Stefano’s collegue and I’m working with them at this memory leak issue.
I have to add a few details to Stefano’s message.

At the same time of the previuos test, he redid the execution with version 10.1 and this is the result:

I also want to inform you that we are using these parameters for the GC:

MONO_GC_PARAMS=bridge-implementation=new,major=marksweep-par-fixed,
   nursery-size=128m,soft-heap-limit=256m,concurrent-sweep,
   bridge-require-precise-merge

(I’ve added carriage return to simplify the readability)

We have changed the parameters because the default ones are not compatible with our device, such as bridge-implementation which by default is tarjan.

Have a nice weekend, best regards,
Francesco

1 Like

Below is a screenshot describing another test run with nursery-size=32m, soft-heap-limit=128m

Throughout the next weekend, we will do intensive testing with version 10.9 and on Monday we will see the results.

Thank you,
Francesco

1 Like

Okay, this is very helpful. As far as I can tell from the trace Stefano posted, there are no leaks with 10.9.0 - it’s in Italian, but if I understand it correctly, the first column is the total number of allocations, while the second is the live ones, which implies that eventually things are getting collected.

That being said, that’s an awful lot of allocations and I’d like to dive deeper and understand where they’re coming from. The Dictionary<string, IntPtr> seems to be coming from the object metadata. As far as I can track it, this is only instantiated when a new Realm instance is created which happens:

  1. When you call Realm.GetInstance(...)
  2. When you call realmObject.Freeze()/realmQuery.Freeze()/etc.

Can you tell me a little bit about your application - are you freezing objects at all? If you are, that is most likely the culprit and I can see a fairly straightforward fix for this issue. If you are not, are you perhaps calling GetInstance very much? E.g. in response to some stream of events? If that’s the case, then we should try and figure out a way to reduce those calls.

Finally, either of these ^ can lead to Realm file growth, which - because the Realm file is memory-mapped - can be perceived as a memory leak, though it will not show up on the .NET profiler as it’s native memory that is being allocated.

2 Likes

Hi Nikola,

sorry for italian language.

This is the meaning of the columns for Allocation tab:

Classe = Class

Conteggio = Count

Attivi = Live

Dimensione = Size

Media = Average

Dimensione conservata = Retained size

In our app, we don’t use the Freeze () method and instead GetInstance is used a lot.

The app is never closed and is active 365/24, it’s made up of about 1300 classes and 250k lines of code.

We mainly use the GetInstance in three ways:

  1. In some Singleton classes where the Realm instance remains active, we use it to receive callbacks to subscriptions for data changes.

  2. At the class level if I need to receive status changes on the current page.

  3. At the method level

Please follow below some code examples:

1)In some Singleton classes, i.e incoming call service

private Realm _realm;

private IDisposable _callToken;


private SingletonClass() // ctor

{

​        _realm = Realm.GetInstance();

​        _callToken = _realm.All<IncomingCall>().SubscribeForNotifications(CallBack);

}

...

...

void Callback(IRealmCollection sender, ChangeSet error, Exception changes)

{

}

...

...

public void Dispose()

{

​        _callToken.Dispose();

​        _realm.Dispose();

}


2)At the class level if I need to receive status changes on the current page, i.e. climate page

private Realm _realm;

private IDisposable _climaToken;


public ClimaPage()

{

​        _realm = Realm.GetInstance();

​        _climaToken = _realm.All<Clima>().SubscribeForNotifications(CallBack);


}

...

...

void Callback(IRealmCollection sender, ChangeSet error, Exception changes)

{

}

...

...

public void Dispose()

{

​        _climaToken.Dispose();

​        _realm.Dispose();

}


3)At the method level, i.e. query to retrieve lights

public GetLigths()

{

​        Realm realm = Realm.GetInstance();

​        var ligths = realm.All<Light>().ToList();

​        realm.Dispose();

}

As far as you said, you don’t see memory leaks in the profiler trace with version 10.9.0 but we can see a continuous memory usage increase as the retained memory trace is showing us.

We investigated all our code and we are sure we always dispose any REALM instance in case 2 and 3.

Case 1 of course, being always active, is not disposed during app lifecycle.

About your suggestion “…we should try and figure out a way to reduce those calls (GetInstance)”, is there any pattern you may suggest? i.e. a pool of instances?

Thanks

Stefano

2 Likes

That’s great info and I feel like we’re really narrowing down on the culprit here. These calls to GetInstance are definitely allocation-heavy currently, though I think we can definitely add some caches that will alleviate most of the pain, assuming you always call GetInstance with the same configuration. I’ll try and hack something together this week and prepare a prerelease package for your team to test out. It won’t be something usable in production, but should at least indicate whether we’re on the right path.

1 Like

Thank for your reply @nirinchev,

I can confirm that we’re always using the same setting in order to get any Realm instance.

We now rely on your debug version in order to proceed to analyze this issue in our test environment.

I would like to share with you another overnight test we’ve done in the meanwhile.

In order to try to release the allocated memory by the subscription token and see what happens, we’ve tried to Dispose() it and create it again every time we get a notification (of course it’s a test pattern not really applicable to production).

Please find here below the code example:

private bool _dontExecCallback = false;
private Realm _realm;
private IDisposable _callToken;
 
private SingletonClass() // ctor
{
               _realm = Realm.GetInstance();
               _callToken = _realm.All<IncomingCall>().SubscribeForNotifications(CallBack);
}
 
private Callback(IRealmCollection<IncomingCall> sender, ChangeSet changes, Exception error)
{
               if (_dontExecCallback)
               {
                              _dontExecCallback = false;
                              return;
               }
 
               __callToken.Dispose();
               __callToken = null;
               _dontExecCallback = true;
               _callToken = _realm.All<IncomingCall>().SubscribeForNotifications(CallBack);
}
 
public void Dispose()
{
               _callToken.Dispose();
               _realm.Dispose();
}

In your opinion, is this pattern better performing for our issue?

Furthermore, I would ask you to check this crash, which happened on our Android 5 device, which doesn’t seem to be related to an excessive memory usage; at this point the app was using about 320MB RAM out of a total of 1 GB (our app is a launcher ).

02-01 23:59:01.411 V/mono-stdout(15242): [Threads 2][Realm 56][Utils.TraceException:252] - W - Managed Exception in DataManager.UpdateSystemFunction:1449 -> Realms.Exceptions.RealmException: mmap() failed: Out of memory size: 42180608 offset: 0  at Realms.NativeException.ThrowIfNecessary (System.Func`2[T,TResult] overrider) [0x00011] in <5c9bbded1cb44e63b617fdfa5b1313ec>:0   at Realms.SharedRealmHandle.CancelTransaction () [0x00008] in <5c9bbded1cb44e63b617fdfa5b1313ec>:0   at Realms.Transaction.Rollback () [0x00013] in <5c9bbded1cb44e63b617fdfa5b1313ec>:0   at Realms.Transaction.Dispose () [0x00009] in <5c9bbded1cb44e63b617fdfa5b1313ec>:0   at Realms.Realm.Write[T] (System.Func`1[TResult] function) [0x0002a] in <5c9bbded1cb44e63b617fdfa5b1313ec>:0   at Realms.Realm.Write (System.Action action) [0x0001d] in <5c9bbded1cb44e63b617fdfa5b1313ec>:0   at ByMeLib.DataModel.DataManager.UpdateSystemFunction (Comm.IPConnector.Request.ChangeStatusGatewayRequest csr) [0x00034] in <d3d5592b6e1248949d342a59b4bfc29b>:0
02-01 23:59:01.413 F/libc    (15242): Fatal signal 11 (SIGSEGV), code 1, fault addr 0xbdd43006 in tid 15385 (Thread Pool Wor)
02-01 23:59:01.475 I/DEBUG   (  126): *** *** *** *** *** *** *** *** *** *** *** *** *** *** *** ***
02-01 23:59:01.475 I/DEBUG   (  126): Build fingerprint: 'Android/a93/a93:5.1/LMY47D/build10220845:user/test-keys'
02-01 23:59:01.475 I/DEBUG   (  126): Revision: '0'
02-01 23:59:01.475 I/DEBUG   (  126): ABI: 'arm'
02-01 23:59:01.476 I/DEBUG   (  126): pid: 15242, tid: 15385, name: Thread Pool Wor  >>> com.mtsbyme <<<
02-01 23:59:01.476 I/DEBUG   (  126): signal 11 (SIGSEGV), code 1 (SEGV_MAPERR), fault addr 0xbdd43006
02-01 23:59:01.639 I/DEBUG   (  126):     r0 bdd43000  r1 00000008  r2 00000000  r3 00000000
02-01 23:59:01.639 I/DEBUG   (  126):     r4 bdd43000  r5 78cc6c08  r6 7f11b25c  r7 78cc6b98
02-01 23:59:01.639 I/DEBUG   (  126):     r8 78cc6c58  r9 7f11b240  sl 78cc6ca8  fp 0273a000
02-01 23:59:01.640 I/DEBUG   (  126):     ip 785a6780  sp 78cc6b38  lr 6efbbefb  pc 6ee6f972  cpsr 600f0030
02-01 23:59:01.641 I/DEBUG   (  126):
02-01 23:59:01.641 I/DEBUG   (  126): backtrace:
02-01 23:59:01.641 I/DEBUG   (  126):     #00 pc 000d8972  /data/app/com.mtsbyme-1/lib/arm/librealm-wrappers.so
02-01 23:59:01.641 I/DEBUG   (  126):     #01 pc 00224ef7  /data/app/com.mtsbyme-1/lib/arm/librealm-wrappers.so
02-01 23:59:01.641 I/DEBUG   (  126):     #02 pc 000d888b  /data/app/com.mtsbyme-1/lib/arm/librealm-wrappers.so
02-01 23:59:01.642 I/DEBUG   (  126):     #03 pc 00247d81  /data/app/com.mtsbyme-1/lib/arm/librealm-wrappers.so
02-01 23:59:01.642 I/DEBUG   (  126):     #04 pc 00247a5b  /data/app/com.mtsbyme-1/lib/arm/librealm-wrappers.so
02-01 23:59:01.642 I/DEBUG   (  126):     #05 pc 00243ffd  /data/app/com.mtsbyme-1/lib/arm/librealm-wrappers.so
02-01 23:59:01.642 I/DEBUG   (  126):     #06 pc 002465a3  /data/app/com.mtsbyme-1/lib/arm/librealm-wrappers.so
02-01 23:59:01.643 I/DEBUG   (  126):     #07 pc 00016467  /system/lib/libc.so (__pthread_start(void*)+30)
02-01 23:59:01.643 I/DEBUG   (  126):     #08 pc 00014393  /system/lib/libc.so (__start_thread+6)
 
02-01 23:59:14.623 I/Zygote  (  132): Process 15242 exited due to signal (11)
02-01 23:59:14.653 I/ActivityManager(  492): Process com.mtsbyme (pid 15242) has died

Can this be usefull?

Furthermore, do you think a confcall would be feasible in order to do some test together and work direclty on our app?
We are in Italy (CET) and of course we have to take into account time differences.

Best regards, Francesco

ps: We saw that we can only reply 3 times because we are newbies on this forum. How can we extend this limit in order not to miss any communication?

1 Like

Disposing and creating a subscription on every notification is likely not a good idea as it’s reasonably expensive. Based on the last trace provided, I don’t believe subscriptions are the cause of the issue.

Regarding the OOM crash - can you check the size of the Realm file while your application is running? I have a hunch that it is increasing which will imply that there’s some version pinning going on and would explain the memory leaks.

1 Like

Hi Nikola, replying line by line:
Disposing and creating a subscription on every notification is likely not a good idea as it’s reasonably expensive. Based on the last trace provided, I don’t believe subscriptions are the cause of the issue.”
You are right, we did it only for testing purposes in order to see how the memory increase changed. We know it’s not a clean solution.

Regarding the OOM crash - can you check the size of the Realm file while your application is running?
As soon as the app crashed the DB file was about 40 MB but during normal running, we saw it growing up to hundreds of MBs with no decrease untill we do a DB compact.

I have a hunch that it is increasing which will imply that there’s some version pinning going on and would explain the memory leaks.”
The fact we are keeping Instances always active for the whole lifecycle of our app, would cause the version pinning you are talking about?
Can you share a way to monitor these version pinning while app is running?

I’m sorry for all these questions but this topic is really mind blowing and causing lots of issues.

1 Like

Okay, so the filesize growth definitely points to version pinning. To give you some context, when you access data in Realm on any particular thread, we need to give you a consistent view of the data, regardless of what’s happening in other threads. For example, if you’re reading properties of a Person object, you don’t want them to be garbled mid-read. That’s why we’ll pin a version of the Realm at this point of time. As changes are coming from other threads, we’ll write them in a separate location. For example, if you change the name of the person, your file will look (very roughly) like:

common: person1: { "LastName": "Irinchev", Age: 33, ... }
version 1: person1: { "FirstName": "Nikola" }
version 2: person1: { "FirstName": "Nick" }

When the Realm at version1 is refreshed (either manually or automatically), we’ll discard the pinned version 1 and free up the space. As you can imagine, if you have a lot of these versions, the filesize can grow significantly, even if your code is just changing the same property over and over.

Now, for the more practical stuff - how do you avoid this :slight_smile: First, I’d recommend reading the threading section in the docs as it explains things in more detail, but the tl;dr is that there are two types of threads - ones that have SynchronizationContext installed (typically the main thread) and those that don’t.

  1. For threads with synchronization context installed, realms are refreshed automatically when the thread is idle. Those are also the only threads where you can receive notifications automatically, so I imagine most of your Realm instances are open on the main thread. Version pinning here can occur if the main thread is busy for extended periods of time. If your app is doing excessive work on the main thread (freezing it), this may lead to a backlog of updates, which leads to even more work to update to the new state and so on.
  2. For background threads, Realms can be refreshed manually by calling Refresh, but the recommendation is to try and keep the Realm instance open as little as possible. My guess is that in the example you posted, that would be use case 3 - “At the method level, i.e. query to retrieve lights”. Here version pinning can occur if you keep a Realm instance open for a long time - either because you don’t dispose of it correctly or because a lot of time passes between opening and disposing of the instance.

I have four suggestions based on the usage patterns you’ve posted above:

  1. Double check that your singleton Realm instance is indeed opened on the main thread/thread with a synchronization context. I’m 99% certain this is the case as you wouldn’t get any change notifications otherwise, but it’s an easy one to cross out.
  2. Double check that your class-level Realm instances (use case 2: “At the class level if I need to receive status changes on the current page, i.e. climate page”) are also opened on the main thread. I expect this to be the case, but again, let’s be safe.
  3. For use case 3 - opening a Realm at the method level, make sure that whenever this happens on a background thread (i.e. SynchronizationContext.Current is null), you’re keeping the Realm open for as little as possible. Here, it might be worth adding some timing to get statistics about how long the Realm instance is open.
  4. I’ve talked to our Core team and they shared that when you have lots of notifiers setup combined with lots of writers, it’s theoretically possible to hit a pathological behavior of the notification mechanism where calculating changes between two versions takes longer than producing them, resulting in the notifier thread never catching up with new writes. This would manifest in the notifier thread consuming 100% cpu for extended periods of time (possibly for the entire lifetime of the application). I’m not an Android expert, but can you profile CPU usage while your application is running and see if there’s a CPU core that’s running at 100% for long periods of time?

Finally, I’m open to setting up a conf call to discuss/brainstorm this further, but I’d like to first try to collect as many clues as possible, especially for things that require longer data collection times to make sure we don’t waste time during the call for this.

3 Likes

Hey @Massimo_Ceccato great job producing a repro case, that would help us immensely! I’m getting a 404 trying to access the repo though, which I guess is because it’s a private repo. Can you please invite me as a collaborator - my github handle is also @nirinchev.

Hi @nirinchev - I had to delete our latest post since we found a mistake in the test app that was giving faulse results. I apologize for that.
We keep on investigating our production app and building a repro case for you.

Thank you @Massimo_Ceccato! Looking forward to the repro app.

1 Like