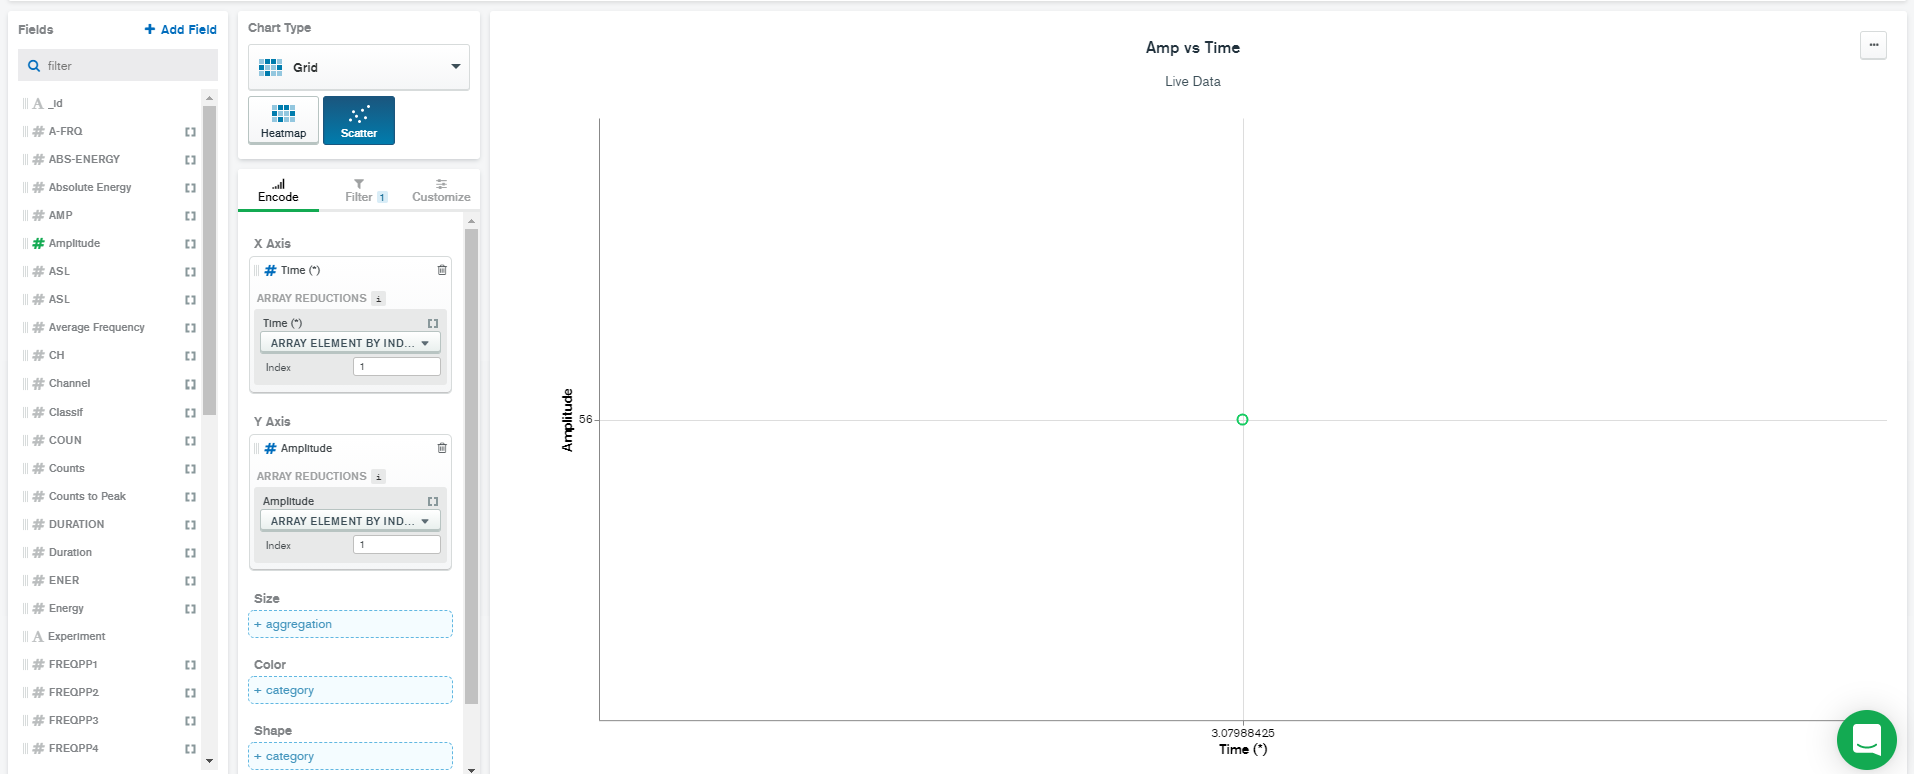
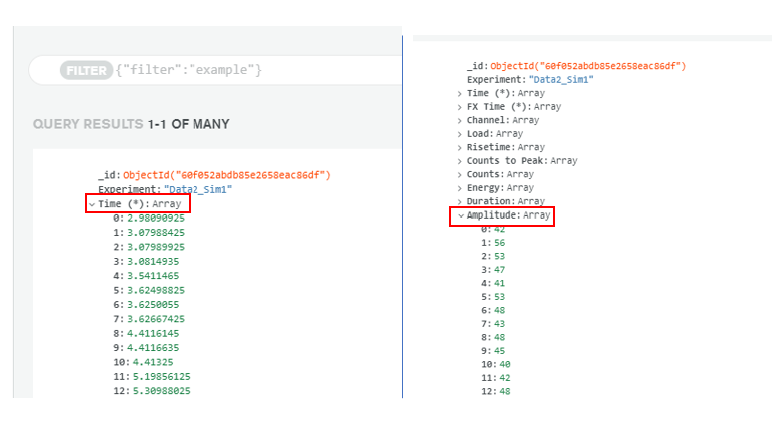
Hello, I am trying to plot data in a document on Mongodb Charts. For example, Document is “Experiment” which has field values such as “Time, Amplitude, etc”. The key ‘Time’ has index and value as 0: 2.3, 1: 2.5, 2: 4.5… where the value is the seconds. I would like to plot this with the respective Amplitude values with 0: 44, 1:99, 2:55… Currently, I can only plot 1 index which is 1 point. How do I plot all points? (Image attached of what I’m currently plotting and the goal).
Looks like this was posted twice; it’s been answered at Plot MongoDB Array by Index - MongoDB Atlas / MongoDB Charts - MongoDB Developer Community Forums.