Hi @Thomas_Maxwell, thanks for trying out Charts!
What you’re trying to do is actually pretty complex, so don’t feel bad that you couldn’t figure it out - but the good news is that it is possible to do what you’re after.
Basically you need to do the following:
- Since you want to treat the
_idfield as a date, you need to click the “…” button next to the_idfield and choose Convert Type, then choose Date. - Now make sure you have a Column chart selected
- Drag the
_idfield (which should now show as a date) onto the X axis. Keep the “Binning” toggle on and choose the binning period you want (Month is the default, and seems to be what you want). - Now also drag the
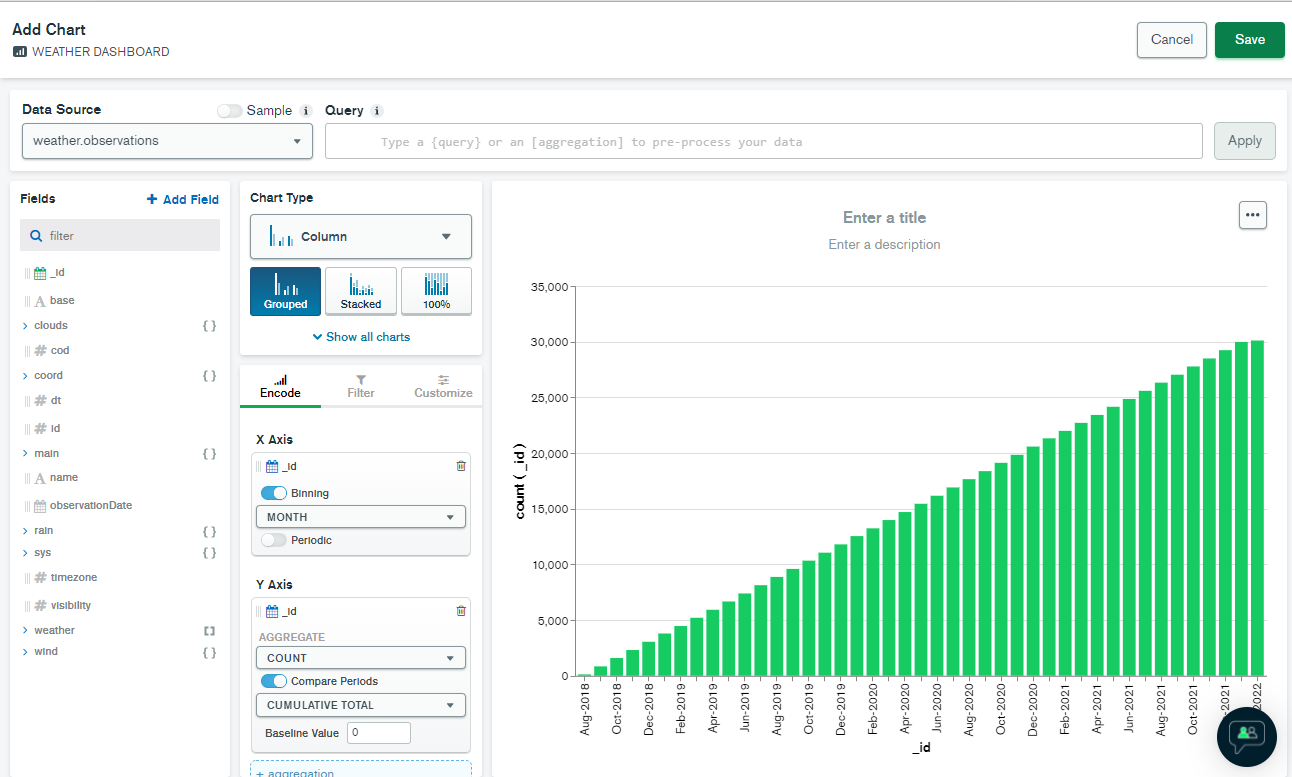
_idfield to the Y axis. Keep the default COUNT aggregation selected. The chart should now show the number of documents created each month. - Finally, enable the “Compare Periods” toggle and leave the deault “Cumulative Total” option selected.
I think this should give you what you want. My example is below.
Tom