Hi, have a question on using Mongo Charts and filters. I had originally implemented the iframe deprecated solution and saw some of my charts were not loading correctly. So I switched to the jwt method with authenticated users, only to find in the last stage that the problem persisted… The last stage was adding filters.
I have a few aggregation queries that basically do this:
- $match based on values being present (answer to a question)
- $addfields to modify the string answer to an int
- $facet to put the int values into buckets
- $project to do some calculations on the values (calculate an NPS score)
When I run this chart on the dashboard with a date filter everything works fine. The problem is that I cannot add the createdDate field to the list of filters allowed in embedding, since it is not there. I have found with other queries that I actually need to project the date field through all stages to make it selectable as a filterable parameter, which seems odd as I believe to have read somewhere that the filters are a special $match fase at the beginning of the query (which also seems the way it works on the Charts dashboard).
TLDR:
- Is it by design that I need to project the filter fields all the way through aggregation queries?
- How would that work on queries that use a $facet fase where I cannot project a date per record?
- Any other way to solve this?
Thanks.
Tried to rewrite the query:
- $match based on values being present (answer to a question)
- $addfields to modify the string answer to an int
- $group to match the values into groups
The problem of course is that I also loose the createdDate here. So at current it seems to be that as soon as I use some type of grouping I loose the ability to filter on dates.
HI @Arnold_Ligtvoet -
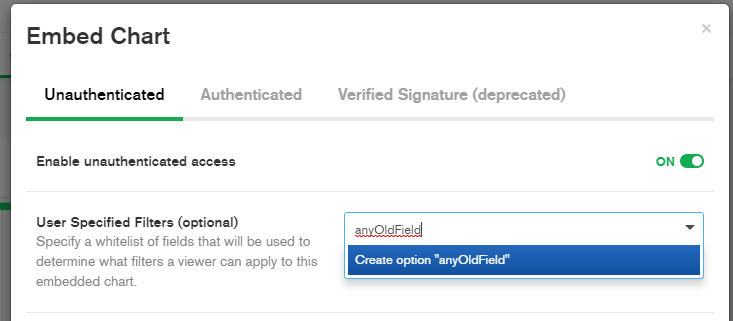
Even though the autocomplete for fields in the Embed Chart dialog only shows fields from the raw collection, you can still add your own fields by choosing the “Create option…” command. This should work in your case where you want to filter on a field created during the custom agg stages.
Tom
Hi Tom,
tested this by adding the filter value I use from embedding as an option. There is a difference, instead of displaying an error on these graphs I now get the title of the graph, but no graph. Tested it with two graphs that have the date field present by default, added the date as user specified filter on the third.
When I load my portal I see the first two graphs with data and the third graph as just the title. When I remove the filter field from my portal and reload, I see all three graphs with data, so I’m pretty sure the filter is what’s killing it.
Thanks Arnold. I think your assessment is correct - assuming the filter is correct, it may be being applied at a different part of the pipeline you what you expected.
Are you able to mail me either a URL of an embedded chart, or if it’s sensitive then just the base URL for the project to let me check the logs? You can reach me at tom.hollander at MongoDB.com.
1 Like