Hi @Andy_Hermann,
Welcome to the MongoDB Developer Community Forum!
The first chart represents the number of connections, the second is the “Memory”-metirc and the last is “System-Memory”-metric. How should I interpret this?
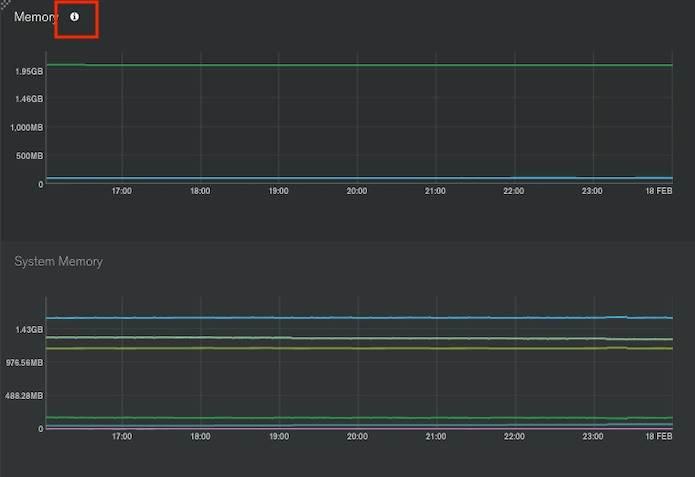
The “Memory” metric is associated with the memory for mongod and wiredTiger processes running on the system. The “System-Memory” metric is associated with the memory for all processes running on the system.
You can find a more in-depth explanation of the metrics by hovering your mouse over the metric name in the charts view and selecting the info “i” button as shown below:
We are also having M10 but if I’m right with the virtual memory, there is no need for an upgrade, right?
Purely based off your screenshot, it does not appear an upgrade to M30 is required (from Memory + System Memory) alone. However, this question may be best suited for Atlas support as they would have a greater view of the metrics outside of Memory and System Memory. There is free Atlas chat support when on the Atlas UI in the bottom right hand corner, it will be a green bubble icon which will open a chat box when selected.
Best Regards,
Jason