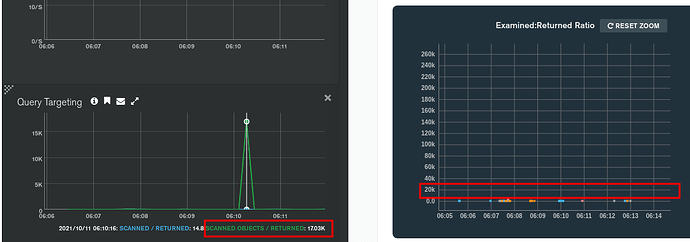
Hi @Ikar_Pohorsky,
If the query is slower than 100ms, it should appear in the cluster logs directly. Maybe that’s the easiest way to find the  .
.
Here is an example on one of my clusters:
I found this entry in the logs:
{"t":{"$date":"2021-10-12T18:26:08.641+00:00"},"s":"I", "c":"COMMAND", "id":51803, "ctx":"conn1348337","msg":"Slow query","attr":{"type":"command","ns":"covid19.global_and_us","command":{"aggregate":"global_and_us","pipeline":[{"$sort":{"date":1}},{"$group":{"_id":null,"first":{"$first":"$date"},"last":{"$last":"$date"}}},{"$project":{"_id":0}}],"cursor":{},"lsid":{"id":{"$uuid":"831e541e-f4c5-4400-a68b-6051d5530fd6"}},"$clusterTime":{"clusterTime":{"$timestamp":{"t":1634063154,"i":1}},"signature":{"hash":{"$binary":{"base64":"2c5NwO0Jt3PZMGme/5v8n6ycQSM=","subType":"0"}},"keyId":6982690098202542081}},"$db":"covid19","$readPreference":{"mode":"primary"}},"planSummary":"IXSCAN { date: 1 }","keysExamined":2278238,"docsExamined":0,"cursorExhausted":true,"numYields":2328,"nreturned":1,"queryHash":"E4944B52","planCacheKey":"E4944B52","reslen":272,"locks":{"ReplicationStateTransition":{"acquireCount":{"w":2392}},"Global":{"acquireCount":{"r":2392}},"Database":{"acquireCount":{"r":2392}},"Collection":{"acquireCount":{"r":2392}},"Mutex":{"acquireCount":{"r":64}}},"storage":{"data":{"bytesRead":14238902,"timeReadingMicros":12997}},"protocol":"op_msg","durationMillis":7803}}
If that doesn’t work, maybe you can try to activate the profiler with a lower slowms which is definitely going to find some  for you.
Also, as you are on Atlas, you don’t have a suggested index in the Performance Advisor ? In my exemple I don’t because it’s already indexed…
Cheers,
Maxime.
![]() query in the Profiler:
query in the Profiler:
