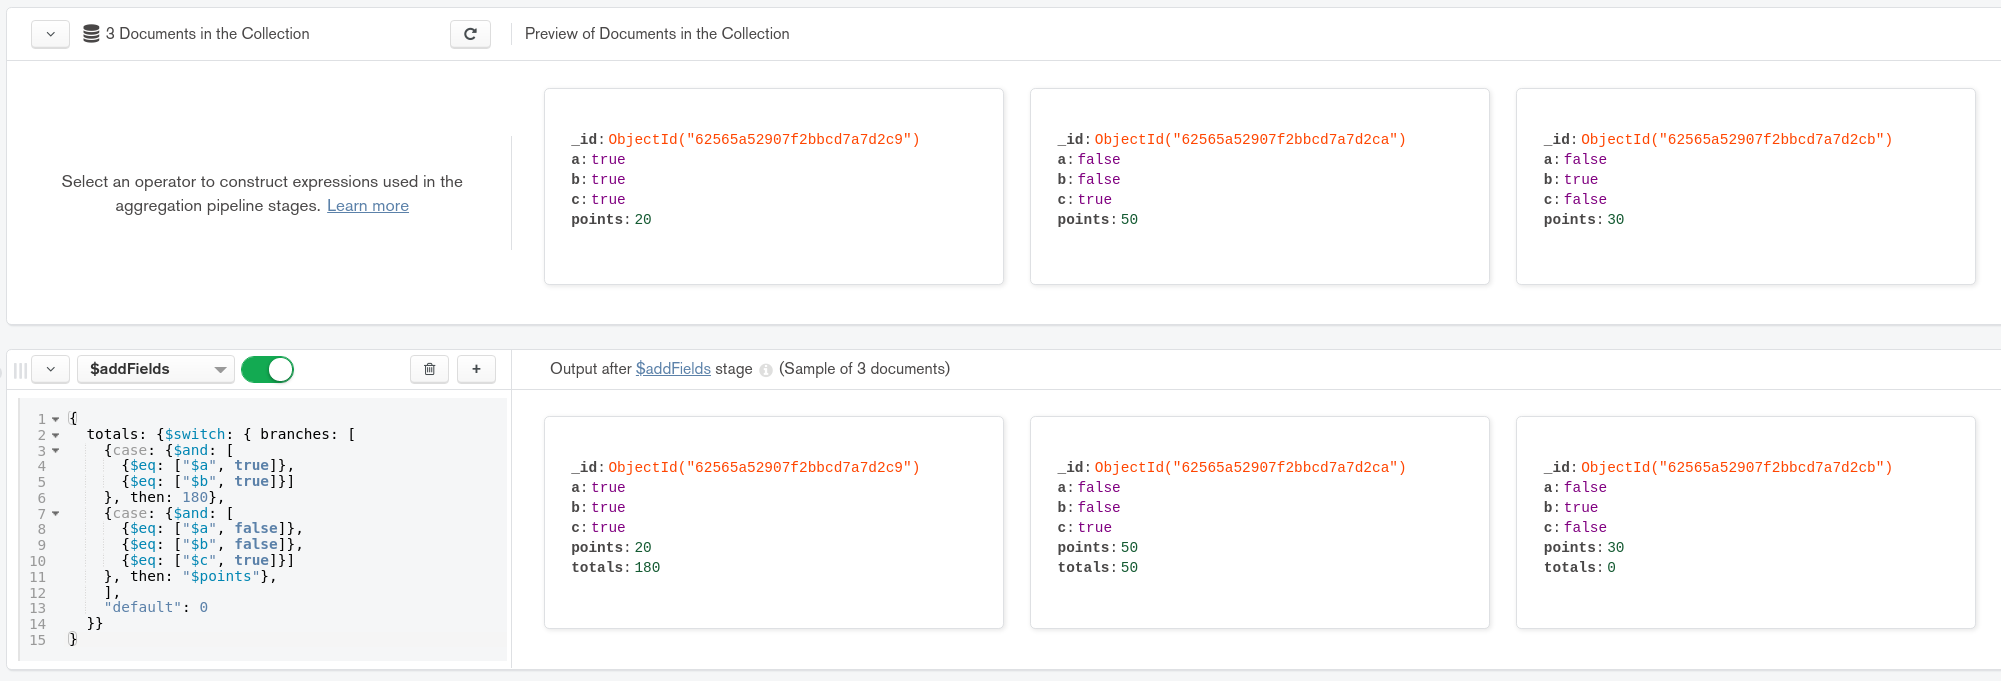
I want to create a Text > Number Chart that will display a new calculatedField Totals following this rule:
For each document that is_type_a == true and is_type_b == True, add 180 to the new calculatedField Totals
For each document that is_type_a == false or is_type_b == false and is_type_c == true, add the field points to the new calculatedField Totals
I am new to the aggregation pipeline and charts, so I am a bit confused on how to achive this. I only know how to create simple calculatedFields and display them.
Any thoughts ?
 !
!