I have a collection of member records that look like the following
{
    "status": {
      "active": true,
      "admin": true,
      ...
    },
    "firstName": "Sean",
    "lastName": "Campbell",
    "courses": [
      {
        "courseId": "some id",
        "courseName": "Working At Heights",
        "courseType": "SAFETY",
        "datesTrained": [
          "1976-05-11T08:19:05.000Z",
          "1987-04-12T10:29:45.000Z",
          "2019-01-12T00:00:00.000Z"
        ],
        "expiryWarningSent": false
      },
      {
        "courseId": "some other id",
        "courseName": "WHMIS 2015",
        "courseType": "SAFETY",
        "datesTrained": [
          "1974-01-02T22:47:37.000Z",
          "2017-06-30T14:24:18.796Z"
        ],
        "expiryWarningSent": false
      }
    ]
  },
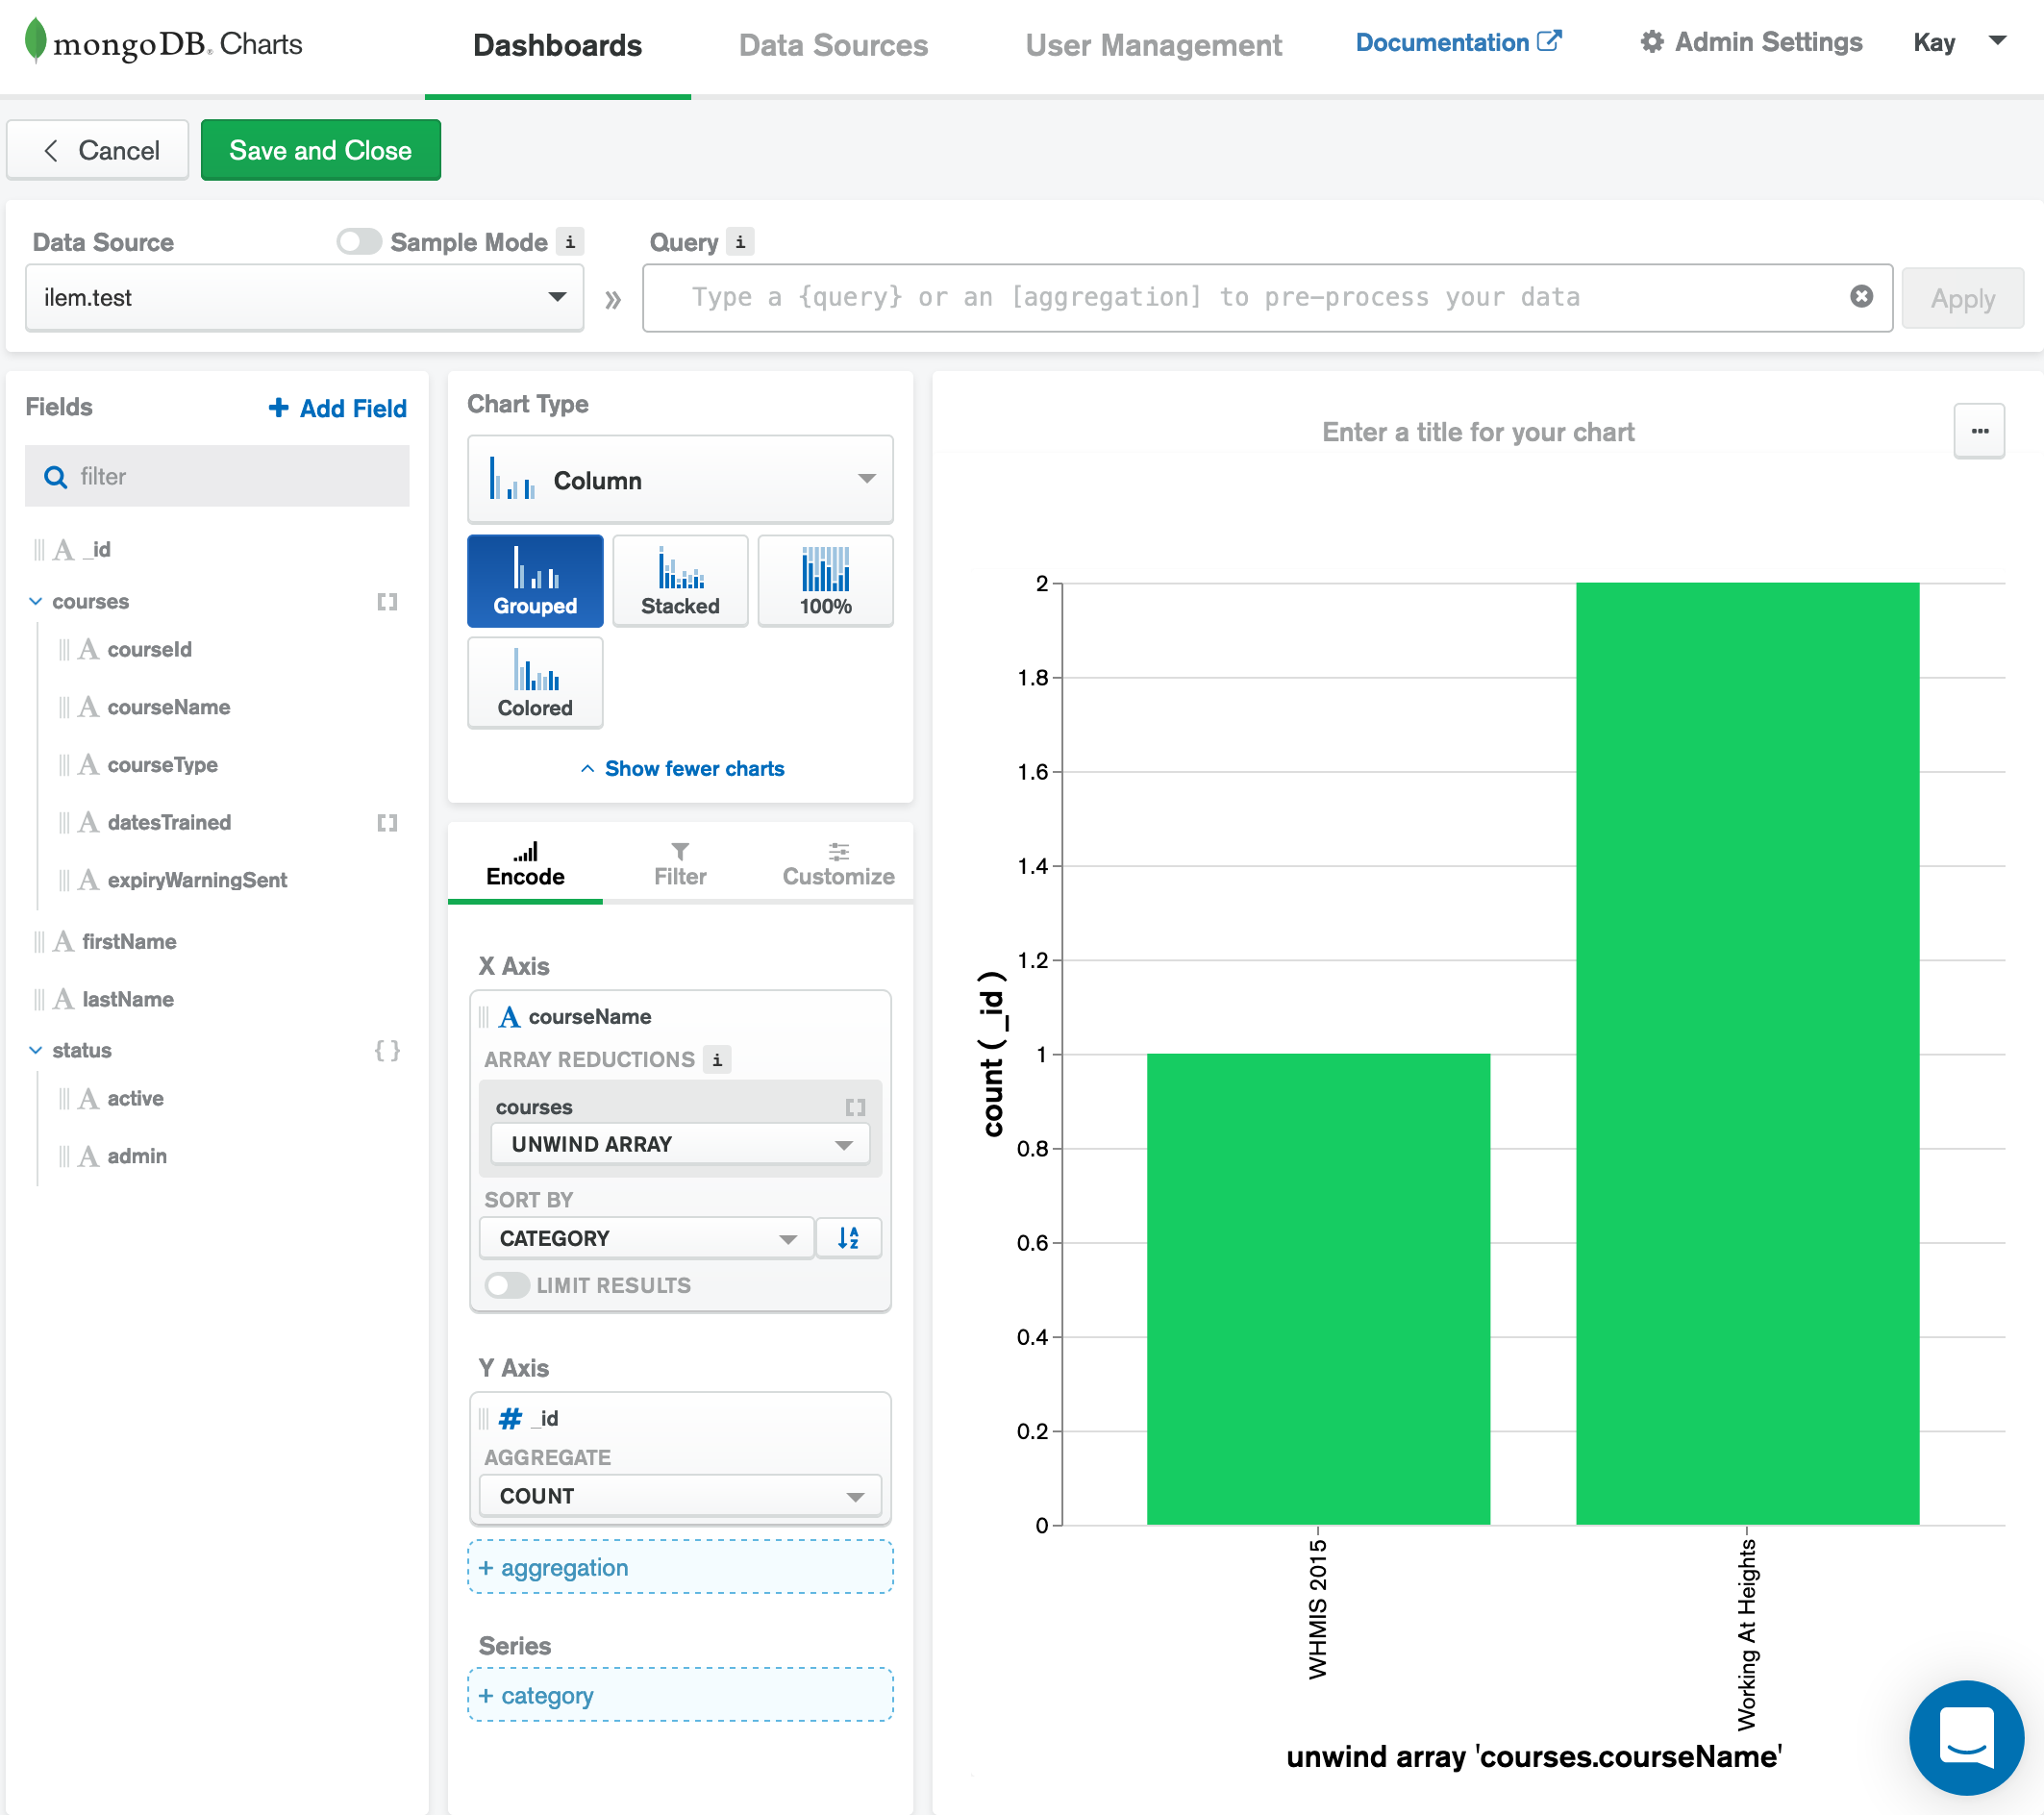
I am looking to build a column chart with MongoDB Charts that will show the number of members who have been trained in each of the courses.
Where the x-axis is the courseName from the unwound (unwind option with charts). But I cannot get the y-axis right. I am given the option to unwind the courses array, but cannot find a way to get the graph to display the count of datesTrained length greater than 1.
I have an aggregation pipeline that returns the values I am looking for from the members collection.
[
  {
    '$unwind': {
      'path': '$courses',
      'preserveNullAndEmptyArrays': false
    }
  }, {
    '$match': {
      'courses.courseType': 'SAFETY',
      'courses.datesTrained.0': {
        '$exists': true
      }
    }
  }, {
    '$sortByCount': '$courses.courseName'
  }
]
Any help is very much appreciated.