Dip in opcounters every 15 mins

When executing performance tests, we are provisioning M30 cluster. During the test, I’ve noticed something very strange. There’s a dip in opcouters every 15 mins.

Whenever there’s a dip in opcounters, I have noticed corresponding spike in avg response time. Our application response times were best between the time ranges 12:00-12:30 & 1:00-1:30 where opcouters is steadily greater than 200/s

This is not a random occurance, we are noticing this pattern pretty much every time we run a load test.

What could be the possible explanation for this anamoly?

Hi @Sai welcome to the community!

There’s really not enough information to tell what’s going on based on only three graphs, but since this is only occuring during a load test (correct me if I’m wrong), then it’s very likely have something to do with the test. The 15 minutes cadence could be entirely accidental, e.g. you’re putting enough load to overwhelm the server so it needs to stop processing incoming work after ~15 mins to catch up with the queued work, then it catches up, then the cycle begins again.

You might want to vary the load test with more (or less) work, and observe if the 15 minutes cadence is repeated, or they have different timings depending on the load you’re putting on them.

The server logs during the test might be more enlightening on what exactly happened.

Also, if this is of concern to you, have you contacted Atlas support for help with this?

Best regards
Kevin

3 Likes

So, we have an M30 atlas cluster with 3 replicas. We’re trying to benchmark our application by running some performance tests. During the run, we observed an oddity with Atlas cluster. We noticed periodic spikes in System CPU usage across all 3 nodes of the replica set.

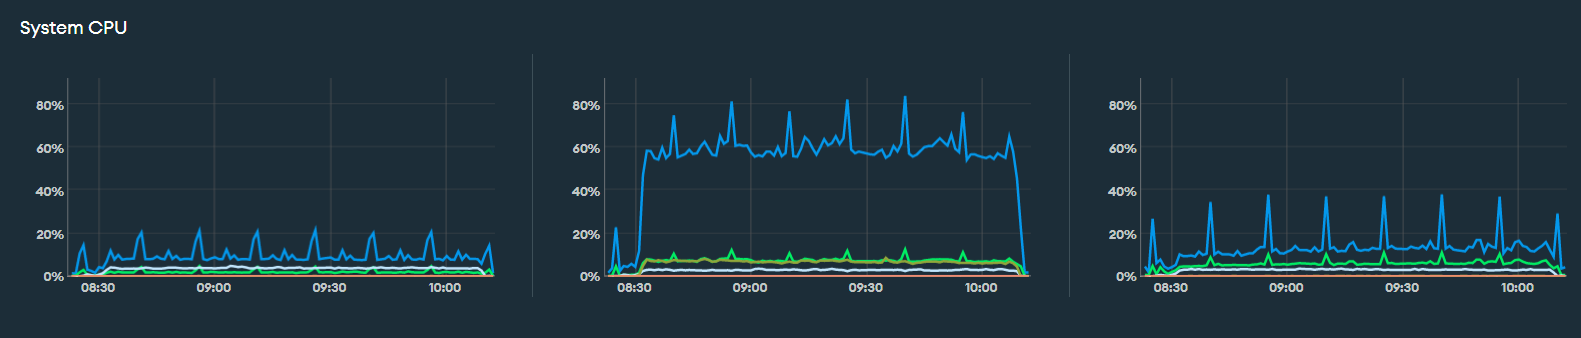
What is causing the spike every 15 mins?

Thank you @kevinadi

Apologies for the delay and confusion.

There was no issue with opcouters, and the cluster size was not M30 from the beginning.

We’ve auto-scaling enabled for our perf Mongo atlas cluster with initial instance size as M10. Major time of our perf test was spent on M10 and M20 instances (as you can tell, the red vertical lines denote the jump from one cluster size to another). As documented atlas provisioned burstable instances which resulted in extreme System CPU Steal % (~130-140%) for large periods of our perf test, which ultimately resulted in poor performance

After that for long-running perf tests we started using M30 instancess and both Process CPU usage and Application response times were very smooth and predictable. But nonetheless as noted here, there were periodic spikes in system CPU usage, although it did not have a drastic effect on the response time I am just curious to know what’s the reason behind periodic spikes in system CPU usage.