Connection count not equally created over different Mongodb replicaset secondary nodes

Hi,

I have a 3 node mongodb replica set cluster, with one node handles write requests and two others handle read requests.

I have also a Spring Boot web server (with Spring Data MongoDB 3.0.6.REALEASE and mongodb-driver-sycn:4.0.5 java), which exposes a simple READ operation over a collection:

db.myCollectionName.aggregate([{ "$sample" : { "size" : 100}}, { "$project" : { "myFieldName" : 1, "_id" : 0}}])

This operation use $sample operator to randomly select 100 documents over a collection having about 100m documents, and project one field.

I use JMeter to do pressure test over the application, with ReadPreference.secondaryPrefererd() configured, it turns out that each secondary node can handle about 600 ops. However, the strange thing is:

One secondary node has 100 more connection count over another, whereas can only handles the same #Ops. The node which bears less connection count also has much less active reads.

We can always repeat this problem if we try to retest more times.

Each secondary node has exactly the same software configuration and hardware setting.

Can anyone give some tips ?

BTW, I notice there is a server selecting algorithm: specifications/server-selection.rst at master · mongodb/specifications · GitHub

I tried to increase localThresholdMS however it does not work.
Hi @Shu_SHANG and welcome in the MongoDB community :muscle: !

I don’t have a proper answer to your question but rather a few comments and a potential answer.

  1. Replica Set (RS) are not designed to scale read operations. Sharding is though. RS are here for High Availability. If you rely on 3 nodes to handle 2000 reads / seconds with a load at 80% on each. If one node fails, the 2 remaining nodes will fail as well (domino effect). Therefore, you aren’t HA anymore and even more likely to bring your entire cluster down as one failure in one of the 3 nodes would overload the entire thing.
    • Primary node handles all the write operations and by default all the reads (default readPreference = primary).
    • Secondaries nodes ALSO handle ALL the write operations (replication) and eventually handle the eventually consistent queries thrown at them using other read preferences (all but “primary”, potentially).
    • Which means that if you use readPreference = secondaryPreferred for all your queries, your 2 secondaries are now doing MORE work than your primary node. As this doesn’t make much sense, I would then recommend to switch to readPreference = nearest so at least all the nodes would share the work load equally, in theory at least, until you have latency issues. Which bring me to…
  2. You have the right idea with localThresholdMS and I think you understood how servers select the node they will send the query too. They take the fastest node respecting the readPreference. Find all the other nodes that also respect that constraint and have a latency smaller than latency fastest node + localThreadholdMS and then they take a random server in this list and send the query to that one.
    Problem is, if you are overloading the nodes with a performance test. Chances are that at some point, you will have your latency > localThreadholdMS and only one of the secondary will enter the selection process. The other one will be eliminated because his latency is greater than fastest node + localThreadholdMS so only the faster node will receive read operations until this one starts lagging behind. The other secondary will now be DDOSed until the other node starts being faster, etc.
    Again, readPreference works to distribute workload across a RS… But it’s a bad idea for these 2 main reasons (HA + latency/distribution).

Cheers,
Maxime.

2 Likes

@MaBeuLux88 Thanks for the reply !

I was thinking, by chaning readPreference, workload can be distributed over a replicas set, you told me that it’s not the case, thanks again for this usable enlightenment.

In fact, during the performance test, the MongoDB cluster does not handle any write operations, thus we can think the two secondary nodes can focus on read operations, while the master node stays idle.

secondaryPreferred() vs nearest()

I’ve tried several things:

2 Secondary nodes, secondaryPreferred()

Two secondary nodes do the work, when the concurrency is 80, the performance reaches the best, TPS reaches about 700+, rt is about 100ms and #ops reaches 400 for each secondary node.

2 Secondary nodes, nearest()

Two secondary nodes as well as the primary node do the work, when the concurrency is 100, the performance reaches the best, TPS reaches about 1000+, rt is about 100ms and #ops reaches 400 for each node.

3 Secondary nodes, secondaryPreferred()

Adding one more secondary node to the cluster (offline copy mode, without degrading the performance), when the concurrency is 100, the performance reaches the best, TPS reaches about 1000+, rt is about 100ms and #ops reaches 400 for each secondary node.

3 Secondary nodes, nearest()

3 secondary ndoes as well as the primary node do the work, when the concurrency is 120, the performance reaches the best, TPS reaches about 1500+, rt is about 80ms and #ops reaches for each node.

Sum up

By changing readPreference from secondaryPreferred() to nearest(), the primary node begins come to share the workload, best number of concurrency climbs up by ~20. For each scenario, as the number of concurrency exceeds the best point, rt begins to degrade and TPS remains the same.

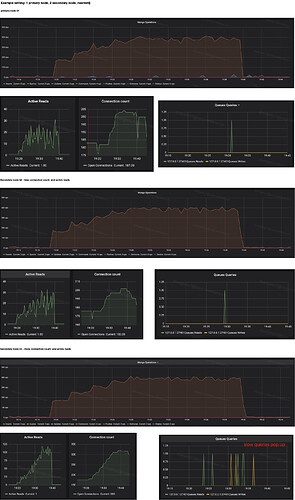
Also, I’ve changed the localThresholdMS to a fairly large value (5000ms) for each scenario, hoping that all server nodes can serve as a candidate. However, the strange thing still remains for each of the scenario, as the performance test goes on, one secondary node still has much more connection count than the other one (two in 3 secondary node case) and the primary master node whereas has the same number of operations. The node bearing more connection count starts to lag behind (as you have said), but as far as I am concerned, it’s not much, as you can see below:

Adding an extra secondary will indeed boost your read performances overall, but if this node isn’t setup properly, you now increased your majority from 2 to 3 and have an even number of nodes which isn’t ideal for the High Availability again :slight_smile:.

How many clients to do have and which language are you using? In Java I think one client can generate maximum about 100 connections. My guess it that one client decides to send its 100 connections to one node for a bit and then re-evaluate at some point if this node is still the fastest node available. I guess that makes the clients a little sticky to one secondary potentially until the driver re-evaluate the best node to send the query to?

You can distribute using the readPreference like you did. But the round robin distribution won’t be absolutely perfect and even because of the server selection algorithm and also because it’s not initially designed for this kind of use and breaks the first reason why RS are built for: HA. Sharding is design for this kind of operations though.
Usually readPreference is used to target a specific node for ad hoc queries or analytics workload (using tags) and the writeConsistency is used to enforce a strong data resilience to avoid rollbacks (== acknowledge writes on the majority of the voting members of the RS).

By the way, what limit are you reaching? What’s making you say that you cannot handle more queries? Doubling the number of clients doesn’t allow more performance? What is saturating? CPU ? RAM ?

It doesn’t look like you are using Atlas here so there are many things that could have been overlooked in the configuration or OS setup that could improve the performances. And the hardware itself is another entire discussion…

Another random idea that I have about your $sample query. I’m not sure how it’s implemented low level. Maybe it’s super efficient. But maybe it could be better.
You mentioned that you have no write operations during this $sample storm.
So maybe you could load in memory all the _id of all the documents in RAM in your clients and then just send find queries with _id $in [list of ids] and maybe this could perform even better with the use of the _id index.

Cheers,
Maxime.

How many clients to do have and which language are you using? In Java I think one client can generate maximum about 100 connections. My guess it that one client decides to send its 100 connections to one node for a bit and then re-evaluate at some point if this node is still the fastest node available. I guess that makes the clients a little sticky to one secondary potentially until the driver re-evaluate the best node to send the query to?

The application is stateless web server, on the application side, the workload is not too much, only 20 ~ 40% of cpu and mem has been used, and TPS remains the same either we use 2 instances or 3 or 4. Number of client is equal to the number application instance, as the client is initialized as singleton.

I am using Spring boot (with Spring Data MongoDB) to expose the API, version of the Java driver is mongodb-driver-sync:4.0.5. Max number of connecton pool has been configured to 1000.

By the way, what limit are you reaching? What’s making you say that you cannot handle more queries? Doubling the number of clients doesn’t allow more performance? What is saturating? CPU ? RAM ?

As I add one more application instance (the Spring web server), total TPS remains the same, #ops for each MongoDB node remains 400 and cannot saturate more queries as far as I can notice, slow queries begins to apear in the secondary node with more #connections. Doubling the number of client seems does not boost the performance, the bottleneck should be on MongoDB side.

Another random idea that I have about your $sample query. I’m not sure how it’s implemented low level. Maybe it’s super efficient. But maybe it could be better.
You mentioned that you have no write operations during this $sample storm.
So maybe you could load in memory all the _id of all the documents in RAM in your clients and then just send find queries with _id $in [list of ids] and maybe this could perform even better with the use of the _id index.

This is a good suggestion. I was thinking about migrating $sample to the application side, however, as the collection needs to be updated frequently, sampling on application is not as simple as on MongoDB, we have to randomly generate the ids whereas those may have already been updated, thus I have chosen to put the $sample operator on the MongoDB side. I will look if there is better workaround for this.

But what’s reaching 100% then? Is it disk IOPS? RAM? CPU?
The problem with your use case, is that you are constantly loading all the docs in RAM randomly so your entire collection is the working set… So I guess the RAM is the bottleneck, no? Therefore, you are probably maxing out your IOPS as many docs can’t possibly be in RAM, unless the entire data set fits in RAM?

By the way, what’s your performance target? 400 isn’t enough apparently then I guess?

MongoDB Atlas could be a great platform for your performance testing. It’s easy to set up an infra, even a sharded one for a few minutes and perform your test, then discard it.

$sample on the app side is a bit desperate indeed. The list of valid _ids could be maintained in RAM with a change stream… But that sounds overly complicated indeed and $sample is much MUCH more simple to implement.

What’s does your hardware look like for this RS? How much RAM, IOPS, CPU? What about the collection? How big is it? If you can’t scale vertically anymore. Then sharding is the next step for better perf.

Cheers,
Maxime.

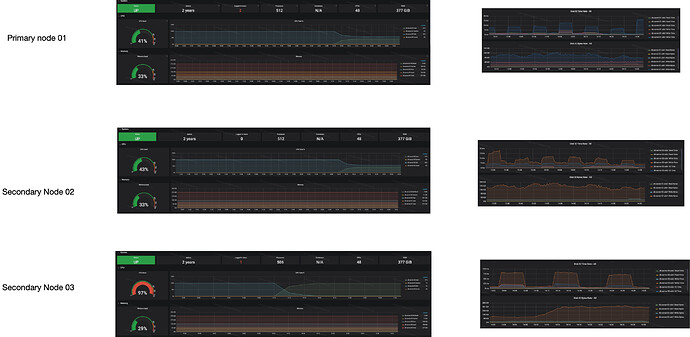
The secondary node with more #connection reaches 100%cpu ( ~350 vs ~220) , whereas the other two reaches about 50%. Here is the monitoring results:z

As you can see, secondary node 03 reaches nearly 100% cpu, memory usgae and disk IOPS is farily low as far as I can understand.

The bottleneck is the CPU, it gives me an impression that all connections went to 03 and saturated its CPU. In the meantime, #connection of 01 and 02 is farily low (with a slightly climbing up), all three nodes have the same #ops, 03 has a little bit more queued queries, but not too much.

It seems that $sample is very CPU-expensive, causing the application and mongodb not able to scale vertically anymore.

400 ops is OK for me currently, but what I want is a proof of scaling. However, in current setting, with $sample operator, scaling out on the MongoDB side with Replica Set seems to be pretty expensive.

Total collection has 930k docuemnts, datasize is about 162MB.

Thanks for the advice, I will reach our system adminstrators to see if MongoDB Atlas would be a better choice for our global service deployments.

162MB is too small to justify a sharded environment though if this is the only workload running on this cluster.
Vertical scaling should be enough to scale this.
The entire dataset fits in RAM so RAM and IOPS shouldn’t be an issue. So I guess only the CPU or the network can be the bottlenecks here.

Can you share a sample document and query just so I can give it a quick dry run on Atlas?

Maybe 1000 connections per client isn’t a good idea as a client might decide to send all of them to the same single node.

Cheers,
Maxime.

Sample document:

{ "name" : "John", "tag" : [ 1,2 ], "gender" : 1, "length" : 4 }
{ "name" : "Lucilla", "tag" : [ 4 ], "gender" : 0, "length" : 7}

name is a String of length length, gender can only either be 1 or 0, tag is a multiple-valued int field, value can can be 0 ~ 9.

Query:

Supposing collection name is abc

db.abc.aggregate([{ "$sample" : { "size" : 100}}, { "$project" : { "name" : 1, "_id" : 0}}])

I’ve tried leaving the max pooling connections to the default value 100, however the same problem remains.