
MongoDB has released version 1.8 of the MongoDB Connector for Apache Kafka with new monitoring and debugging capabilities. In this article, we’ll highlight key features of this release.
JMX monitoring
The MongoDB Connector works with Apache Kafka Connect to provide a way for users to easily move data between MongoDB and the Apache Kafka. The MongoDB connector is written in Java and now implements Java Management Extensions (JMX) interfaces that allow you to access metrics reporting. These metrics will make troubleshooting and performance tuning easier. JMX technology, which is part of the Java platform, provides a simple, standard way for applications to provide metrics reporting with many third-party tools available to consume and present the data.
For those who might not be familiar with JMX monitoring, let’s look at a few key concepts.
An MBean is a managed Java object, which represents a particular component that is being measured or controlled. Each component can have one or more MBean attributes. The MongoDB Connector for Apache Kafka publishes MBeans under the “com.mongodb.kafka.connector” domain.
Many open source tools are available to monitor JMX metrics, such as the console-based JmxTerm or the more feature-complete monitoring and alerting tools like Prometheus. JConsole is also available as part of the Java Development Kit (JDK).
Note: Regardless of your client tool, MBeans for the connector are only available when there are active source or sink configurations defined on the connector.
Visualizing metrics
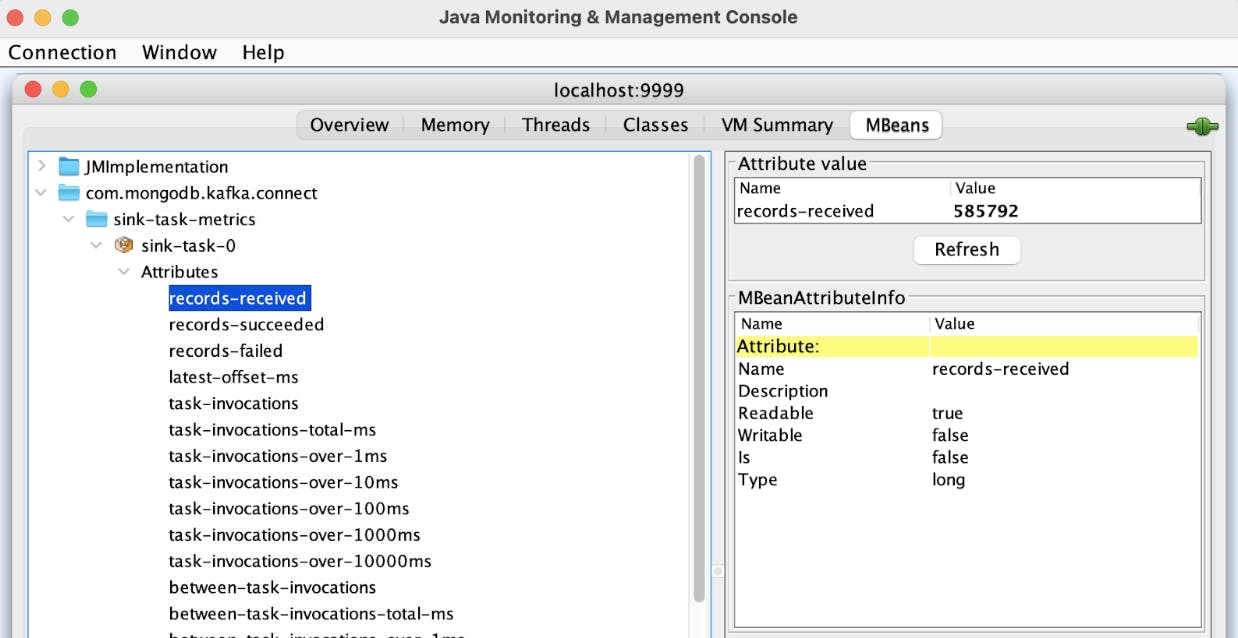
Figure 1 shows some of the metrics exposed by the source connector using JConsole. In this example, a sink task was created and by default is called “sink-task-0”. The applicable metrics are shown in the JConsole MBeans panel. A complete list of both source and sink metrics will be available in the MongoDB Kafka Connector online documentation shortly after the release of 1.8.
MongoDB Atlas is a great platform to store, analyze, and visualize monitoring metrics produced by JMX. If you’d like to try visualizing JMX metrics in MongoDB Atlas generated by the connector, check out jmx2mongo. This tool continuously writes JMX metrics to a MongoDB time series collection. Once the data is in MongoDB Atlas, you can easily create charts from the data like the following:
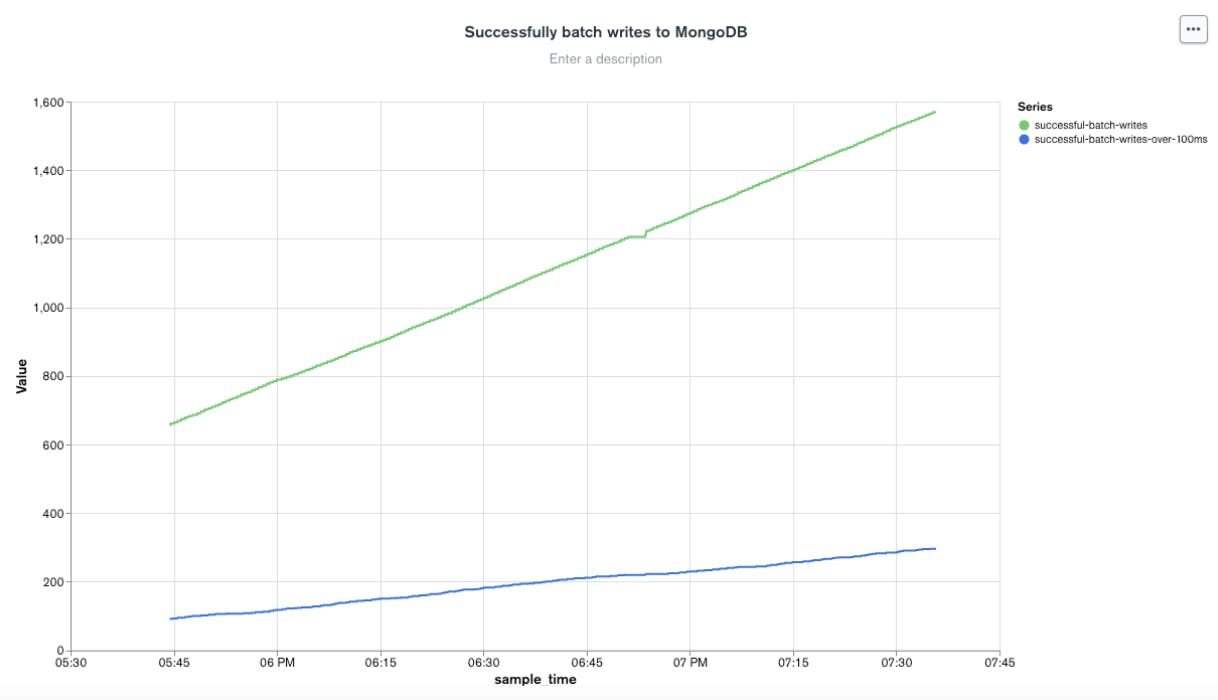
Figure 2 shows the number of successful batch writes performed by a MongoDB sink task and the number of those batch writes that took longer than 100ms to execute. There are many other monitoring use cases available; check out the latest MongoDB Kafka Connector documentation for more information.
Extended debugging
Over the years, the connector team collected requests from users to enhance error messages or provide additional debug information for troubleshooting. In 1.8, you will notice additional log messages and more descriptive errors.
For example, before 1.8, if you set the copy.existing parameter, you may get the log message: “Shutting down executors.” This message is not clear. To address this lack of clarity, the message now reads: “Finished copying existing data from the collection(s).”
These debugging improvements in combination with the new JMX metrics will make it easier for you to gain insight into the connector and help troubleshoot issues you may encounter. If you have ideas for additional metrics or scenarios where additional debugging messages would be helpful, please let us know by filing a JIRA ticket.
For more information on the latest release, check out the MongoDB Kafka Connector documentation. To download the connector, go to the MongoDB Connector repository in GitHub or download from the Confluent Hub.