Wouldn’t it be great if you could connect your data stored in the world’s leading document database to the leading open source monitoring solution? Absolutely! And now you can.
Prometheus has been a longstanding developer favored solution by providing monitoring and alerting functionality for cloud-native environments. It has key features like a multi-dimensional data model with time series support, a flexible query language to leverage their dimensionality called PromQL, and no reliance on distributed storage.
MongoDB meets monitoring like never before
Our integration allows you to view MongoDB hardware and monitoring metrics all within Prometheus. If you were a user of MongoDB and Prometheus before, this means you no longer have to worry about jumping back and forth between applications to view your data.
Our official Prometheus integration provides complete feature parity with Atlas metrics in a secure and supported environment. With a few clicks in the UI, you can configure the integration and set up custom scraping intervals for your Atlas Admin API endpoints to ensure your view in Prometheus is consistently updated based on your preference.
Best of all, this integration is free and available for use with MongoDB Atlas (clusters M10 and higher) and Cloud Manager. We truly believe in the freedom to run anywhere, and that includes viewing your data in your preferred monitoring solutions.
How the Prometheus Integration works with MongoDB
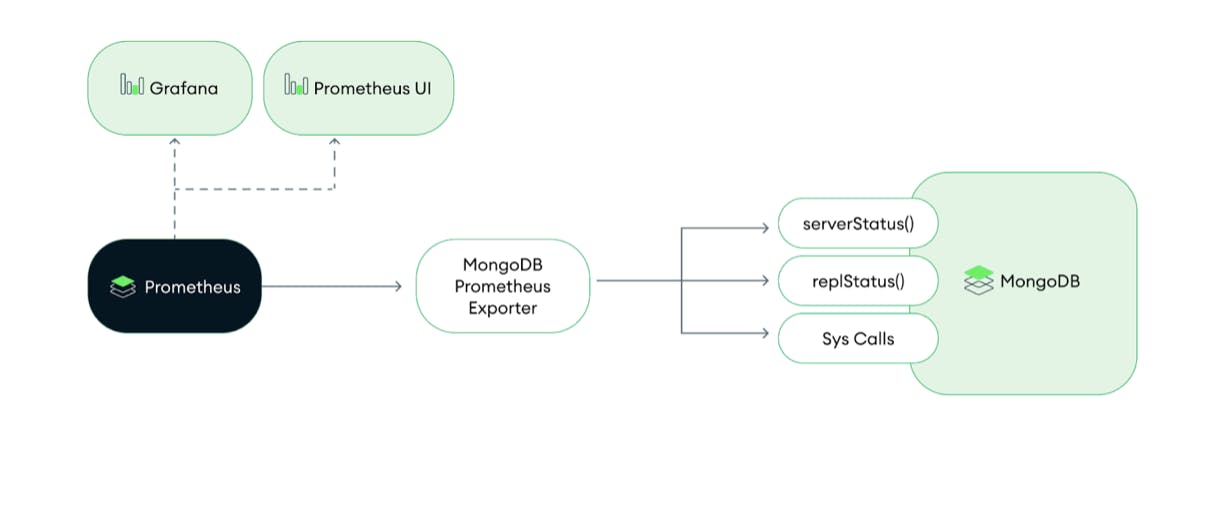
The MongoDB Prometheus integration converts the results of a series of MongoDB commands into Prometheus protocol, allowing Prometheus to scrape the metrics you can view through your MongoDB monitoring charts and more. Once Prometheus successfully collects your metrics, you can parse your metrics in the Prometheus UI or create custom dashboards in Grafana.
Get started with the Prometheus Integration
If you already have an Atlas account, get started by following the instructions below:
Log into your Atlas account.
Click the vertical three dot menu next to the project dropdown in the upper lefthand corner of the screen.
Select “Integrations.” The Prometheus Monitoring Integration is listed here.
Select “Configure” on the Prometheus tile, and follow the guided setup flow.
If you don’t have an Atlas account, create an m10 or higher Atlas cluster and follow the instructions above.
Note: If you were one of the customers who requested this integration, we thank you! We appreciate your feedback and suggestions, and look forward to implementing more in the future. Input is always welcome at feedback.mongodb.com.